Toxoplasma gondii
Taxonomy: cellular organisms; Eukaryota; Sar; Alveolata; Apicomplexa; Conoidasida; Coccidia; Eucoccidiorida; Eimeriorina; Sarcocystidae; Toxoplasma
Average proteome isoelectric point is 6.65
Get precalculated fractions of proteins

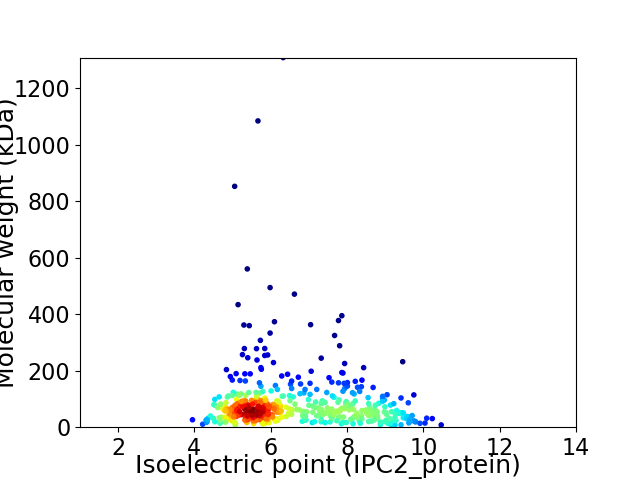
Virtual 2D-PAGE plot for 466 proteins (isoelectric point calculated using IPC2_protein)
Get csv file with sequences according to given criteria:
* You can choose from 21 different methods for calculating isoelectric point
Summary statistics related to proteome-wise predictions


Protein with the lowest isoelectric point:
>tr|Q1JSW7|Q1JSW7_TOXGO Uncharacterized protein OS=Toxoplasma gondii OX=5811 GN=TgIb.0340 PE=4 SV=1
MM1 pKa = 7.51LCPVGFYY8 pKa = 10.53CLEE11 pKa = 4.38GAQTPSEE18 pKa = 4.44CPAGRR23 pKa = 11.84QTAAAGAMRR32 pKa = 11.84EE33 pKa = 4.3EE34 pKa = 4.47EE35 pKa = 4.67CVPCEE40 pKa = 3.75PGFYY44 pKa = 10.15CPEE47 pKa = 4.74PGVSLPCDD55 pKa = 3.14AGYY58 pKa = 11.13VCLEE62 pKa = 4.3GATTATPADD71 pKa = 3.88TTTGKK76 pKa = 9.98QCDD79 pKa = 3.32AGFYY83 pKa = 10.11CPQGSFRR90 pKa = 11.84MLVSQQSGQMMM101 pKa = 4.5
MM1 pKa = 7.51LCPVGFYY8 pKa = 10.53CLEE11 pKa = 4.38GAQTPSEE18 pKa = 4.44CPAGRR23 pKa = 11.84QTAAAGAMRR32 pKa = 11.84EE33 pKa = 4.3EE34 pKa = 4.47EE35 pKa = 4.67CVPCEE40 pKa = 3.75PGFYY44 pKa = 10.15CPEE47 pKa = 4.74PGVSLPCDD55 pKa = 3.14AGYY58 pKa = 11.13VCLEE62 pKa = 4.3GATTATPADD71 pKa = 3.88TTTGKK76 pKa = 9.98QCDD79 pKa = 3.32AGFYY83 pKa = 10.11CPQGSFRR90 pKa = 11.84MLVSQQSGQMMM101 pKa = 4.5
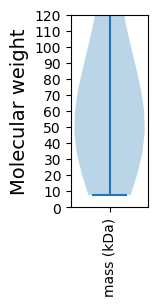
Molecular weight: 10.56 kDa
Isoelectric point according different methods:
Protein with the highest isoelectric point:
>tr|Q1JTG0|Q1JTG0_TOXGO Importin beta-1 subunit putative OS=Toxoplasma gondii OX=5811 GN=TgIa.0580 PE=4 SV=1
MM1 pKa = 6.93SQVSKK6 pKa = 11.04SLASHH11 pKa = 6.76ISASINRR18 pKa = 11.84TGKK21 pKa = 8.94MDD23 pKa = 3.93PVTRR27 pKa = 11.84RR28 pKa = 11.84FNPCLAFCVVNILLLCIGNLTYY50 pKa = 10.73DD51 pKa = 3.65PQSYY55 pKa = 10.31IILRR59 pKa = 11.84EE60 pKa = 3.89AFFQGQEE67 pKa = 4.0HH68 pKa = 6.58RR69 pKa = 11.84RR70 pKa = 11.84HH71 pKa = 6.0CALNLLSISNAYY83 pKa = 9.04AARR86 pKa = 11.84VPPNSGDD93 pKa = 3.37TARR96 pKa = 11.84PLTSSNAGRR105 pKa = 11.84RR106 pKa = 11.84SSSPTPPASTASNRR120 pKa = 11.84HH121 pKa = 5.85PPLHH125 pKa = 5.94QPSTEE130 pKa = 3.44RR131 pKa = 11.84RR132 pKa = 11.84LCHH135 pKa = 7.34DD136 pKa = 4.28GFQEE140 pKa = 4.07GRR142 pKa = 11.84NRR144 pKa = 11.84QHH146 pKa = 6.73RR147 pKa = 11.84RR148 pKa = 11.84AEE150 pKa = 4.23APASLPVFQDD160 pKa = 3.03VTIPTGVRR168 pKa = 11.84PPRR171 pKa = 11.84FHH173 pKa = 7.1CLWASRR179 pKa = 11.84KK180 pKa = 8.25QAALLVQRR188 pKa = 11.84VRR190 pKa = 11.84QGRR193 pKa = 11.84RR194 pKa = 11.84LLYY197 pKa = 9.68TSAIDD202 pKa = 3.49RR203 pKa = 11.84QGYY206 pKa = 9.06KK207 pKa = 9.75LARR210 pKa = 11.84MKK212 pKa = 10.48VPCARR217 pKa = 11.84KK218 pKa = 9.23FLDD221 pKa = 3.51DD222 pKa = 4.19CRR224 pKa = 11.84NTGEE228 pKa = 3.84GCYY231 pKa = 10.83NKK233 pKa = 9.33FHH235 pKa = 7.51CINIYY240 pKa = 10.5YY241 pKa = 7.74NTTVTHH247 pKa = 6.61TILRR251 pKa = 11.84TLLL254 pKa = 3.74
MM1 pKa = 6.93SQVSKK6 pKa = 11.04SLASHH11 pKa = 6.76ISASINRR18 pKa = 11.84TGKK21 pKa = 8.94MDD23 pKa = 3.93PVTRR27 pKa = 11.84RR28 pKa = 11.84FNPCLAFCVVNILLLCIGNLTYY50 pKa = 10.73DD51 pKa = 3.65PQSYY55 pKa = 10.31IILRR59 pKa = 11.84EE60 pKa = 3.89AFFQGQEE67 pKa = 4.0HH68 pKa = 6.58RR69 pKa = 11.84RR70 pKa = 11.84HH71 pKa = 6.0CALNLLSISNAYY83 pKa = 9.04AARR86 pKa = 11.84VPPNSGDD93 pKa = 3.37TARR96 pKa = 11.84PLTSSNAGRR105 pKa = 11.84RR106 pKa = 11.84SSSPTPPASTASNRR120 pKa = 11.84HH121 pKa = 5.85PPLHH125 pKa = 5.94QPSTEE130 pKa = 3.44RR131 pKa = 11.84RR132 pKa = 11.84LCHH135 pKa = 7.34DD136 pKa = 4.28GFQEE140 pKa = 4.07GRR142 pKa = 11.84NRR144 pKa = 11.84QHH146 pKa = 6.73RR147 pKa = 11.84RR148 pKa = 11.84AEE150 pKa = 4.23APASLPVFQDD160 pKa = 3.03VTIPTGVRR168 pKa = 11.84PPRR171 pKa = 11.84FHH173 pKa = 7.1CLWASRR179 pKa = 11.84KK180 pKa = 8.25QAALLVQRR188 pKa = 11.84VRR190 pKa = 11.84QGRR193 pKa = 11.84RR194 pKa = 11.84LLYY197 pKa = 9.68TSAIDD202 pKa = 3.49RR203 pKa = 11.84QGYY206 pKa = 9.06KK207 pKa = 9.75LARR210 pKa = 11.84MKK212 pKa = 10.48VPCARR217 pKa = 11.84KK218 pKa = 9.23FLDD221 pKa = 3.51DD222 pKa = 4.19CRR224 pKa = 11.84NTGEE228 pKa = 3.84GCYY231 pKa = 10.83NKK233 pKa = 9.33FHH235 pKa = 7.51CINIYY240 pKa = 10.5YY241 pKa = 7.74NTTVTHH247 pKa = 6.61TILRR251 pKa = 11.84TLLL254 pKa = 3.74
Molecular weight: 28.62 kDa
Isoelectric point according different methods:
Peptides (in silico digests for buttom-up proteomics)
Below you can find in silico digests of the whole proteome with Trypsin, Chymotrypsin, Trypsin+LysC, LysN, ArgC proteases suitable for different mass spec machines.| Try ESI |
 |
|---|
| ChTry ESI |
 |
|---|
| ArgC ESI |
 |
|---|
| LysN ESI |
 |
|---|
| TryLysC ESI |
 |
|---|
| Try MALDI |
 |
|---|
| ChTry MALDI |
 |
|---|
| ArgC MALDI |
 |
|---|
| LysN MALDI |
 |
|---|
| TryLysC MALDI |
 |
|---|
| Try LTQ |
 |
|---|
| ChTry LTQ |
 |
|---|
| ArgC LTQ |
 |
|---|
| LysN LTQ |
 |
|---|
| TryLysC LTQ |
 |
|---|
| Try MSlow |
 |
|---|
| ChTry MSlow |
 |
|---|
| ArgC MSlow |
 |
|---|
| LysN MSlow |
 |
|---|
| TryLysC MSlow |
 |
|---|
| Try MShigh |
 |
|---|
| ChTry MShigh |
 |
|---|
| ArgC MShigh |
 |
|---|
| LysN MShigh |
 |
|---|
| TryLysC MShigh |
 |
|---|
General Statistics
Number of major isoforms |
Number of additional isoforms |
Number of all proteins |
Number of amino acids |
Min. Seq. Length |
Max. Seq. Length |
Avg. Seq. Length |
Avg. Mol. Weight |
|---|---|---|---|---|---|---|---|
0 |
372232 |
68 |
12269 |
798.8 |
86.93 |
Amino acid frequency
Ala |
Cys |
Asp |
Glu |
Phe |
Gly |
His |
Ile |
Lys |
Leu |
|---|---|---|---|---|---|---|---|---|---|
10.089 ± 0.103 | 2.059 ± 0.066 |
4.835 ± 0.068 | 7.995 ± 0.139 |
3.455 ± 0.055 | 7.599 ± 0.124 |
2.119 ± 0.035 | 2.383 ± 0.085 |
4.166 ± 0.11 | 8.947 ± 0.123 |
Met |
Asn |
Gln |
Pro |
Arg |
Ser |
Thr |
Val |
Trp |
Tyr |
|---|---|---|---|---|---|---|---|---|---|
1.508 ± 0.055 | 2.375 ± 0.051 |
6.214 ± 0.121 | 4.01 ± 0.066 |
8.121 ± 0.153 | 10.506 ± 0.229 |
5.107 ± 0.065 | 5.992 ± 0.112 |
1.007 ± 0.025 | 1.512 ± 0.055 |
Most of the basic statistics you can see at this page can be downloaded from this CSV file
Proteome-pI is available under Creative Commons Attribution-NoDerivs license, for more details see here
| Reference: Kozlowski LP. Proteome-pI 2.0: Proteome Isoelectric Point Database Update. Nucleic Acids Res. 2021, doi: 10.1093/nar/gkab944 | Contact: Lukasz P. Kozlowski |
