Subdoligranulum variabile DSM 15176
Taxonomy: cellular organisms; Bacteria; Terrabacteria group; Firmicutes; Clostridia; Eubacteriales; Oscillospiraceae; Subdoligranulum; Subdoligranulum variabile
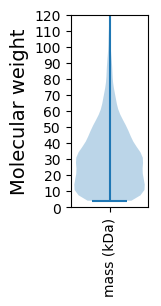
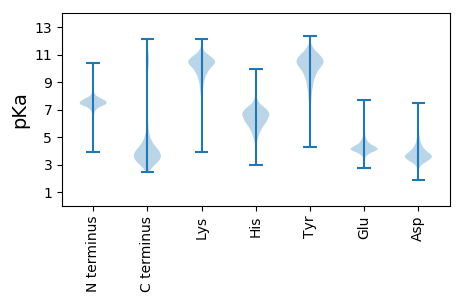
Average proteome isoelectric point is 6.41
Get precalculated fractions of proteins

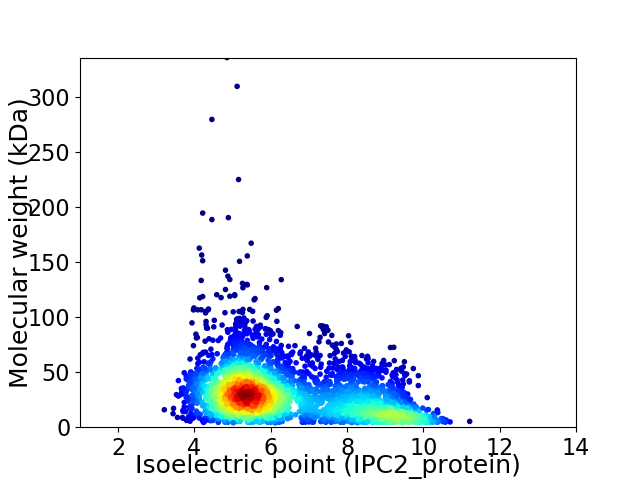
Virtual 2D-PAGE plot for 3378 proteins (isoelectric point calculated using IPC2_protein)
Get csv file with sequences according to given criteria:
* You can choose from 21 different methods for calculating isoelectric point
Summary statistics related to proteome-wise predictions


Protein with the lowest isoelectric point:
>tr|D1PJT2|D1PJT2_9FIRM Transcriptional regulator GntR family OS=Subdoligranulum variabile DSM 15176 OX=411471 GN=SUBVAR_04652 PE=4 SV=1
MM1 pKa = 7.59KK2 pKa = 10.36LKK4 pKa = 9.41KK5 pKa = 8.93TLSLCLAALLTAGLVGCGSTATTDD29 pKa = 3.02STAASDD35 pKa = 4.06SAASTAEE42 pKa = 4.06TGTEE46 pKa = 4.09ADD48 pKa = 3.43TTAAPDD54 pKa = 3.75GDD56 pKa = 4.38GDD58 pKa = 4.1PTTLTVAMEE67 pKa = 4.41CAYY70 pKa = 10.47APYY73 pKa = 10.74NWTQSDD79 pKa = 3.8DD80 pKa = 3.89SNGAVQIRR88 pKa = 11.84DD89 pKa = 3.59SSDD92 pKa = 2.9YY93 pKa = 11.09AYY95 pKa = 10.51GYY97 pKa = 11.18DD98 pKa = 3.3VMMAKK103 pKa = 10.3KK104 pKa = 9.65IAEE107 pKa = 3.95ALGQNVQVVKK117 pKa = 10.88LDD119 pKa = 3.39WDD121 pKa = 3.96SLIPAVMSGDD131 pKa = 3.72VDD133 pKa = 3.99CVIAGQSITSEE144 pKa = 3.93RR145 pKa = 11.84AQQVDD150 pKa = 3.88FSDD153 pKa = 4.25PYY155 pKa = 10.26YY156 pKa = 9.22YY157 pKa = 11.11ASIITLVKK165 pKa = 10.34KK166 pKa = 10.54DD167 pKa = 3.67GPYY170 pKa = 11.29ANAKK174 pKa = 9.75SVADD178 pKa = 4.31LSGATCTSQLGTIWYY193 pKa = 7.85DD194 pKa = 2.92NCLPQIPDD202 pKa = 3.6ANILPAQEE210 pKa = 4.08TAPAMLVALNSGACDD225 pKa = 3.07VVVTDD230 pKa = 5.34RR231 pKa = 11.84PTAQAALVAYY241 pKa = 8.86PDD243 pKa = 4.48FVALDD248 pKa = 3.74FGGGDD253 pKa = 3.61EE254 pKa = 4.85DD255 pKa = 4.57FQVSDD260 pKa = 3.62EE261 pKa = 5.31DD262 pKa = 3.87INIGISMKK270 pKa = 10.51KK271 pKa = 10.54GNTALKK277 pKa = 10.44DD278 pKa = 4.02AINGVLATMTTDD290 pKa = 4.71DD291 pKa = 4.84YY292 pKa = 11.44NTMMDD297 pKa = 3.73EE298 pKa = 4.9AISVQPLSEE307 pKa = 3.96
MM1 pKa = 7.59KK2 pKa = 10.36LKK4 pKa = 9.41KK5 pKa = 8.93TLSLCLAALLTAGLVGCGSTATTDD29 pKa = 3.02STAASDD35 pKa = 4.06SAASTAEE42 pKa = 4.06TGTEE46 pKa = 4.09ADD48 pKa = 3.43TTAAPDD54 pKa = 3.75GDD56 pKa = 4.38GDD58 pKa = 4.1PTTLTVAMEE67 pKa = 4.41CAYY70 pKa = 10.47APYY73 pKa = 10.74NWTQSDD79 pKa = 3.8DD80 pKa = 3.89SNGAVQIRR88 pKa = 11.84DD89 pKa = 3.59SSDD92 pKa = 2.9YY93 pKa = 11.09AYY95 pKa = 10.51GYY97 pKa = 11.18DD98 pKa = 3.3VMMAKK103 pKa = 10.3KK104 pKa = 9.65IAEE107 pKa = 3.95ALGQNVQVVKK117 pKa = 10.88LDD119 pKa = 3.39WDD121 pKa = 3.96SLIPAVMSGDD131 pKa = 3.72VDD133 pKa = 3.99CVIAGQSITSEE144 pKa = 3.93RR145 pKa = 11.84AQQVDD150 pKa = 3.88FSDD153 pKa = 4.25PYY155 pKa = 10.26YY156 pKa = 9.22YY157 pKa = 11.11ASIITLVKK165 pKa = 10.34KK166 pKa = 10.54DD167 pKa = 3.67GPYY170 pKa = 11.29ANAKK174 pKa = 9.75SVADD178 pKa = 4.31LSGATCTSQLGTIWYY193 pKa = 7.85DD194 pKa = 2.92NCLPQIPDD202 pKa = 3.6ANILPAQEE210 pKa = 4.08TAPAMLVALNSGACDD225 pKa = 3.07VVVTDD230 pKa = 5.34RR231 pKa = 11.84PTAQAALVAYY241 pKa = 8.86PDD243 pKa = 4.48FVALDD248 pKa = 3.74FGGGDD253 pKa = 3.61EE254 pKa = 4.85DD255 pKa = 4.57FQVSDD260 pKa = 3.62EE261 pKa = 5.31DD262 pKa = 3.87INIGISMKK270 pKa = 10.51KK271 pKa = 10.54GNTALKK277 pKa = 10.44DD278 pKa = 4.02AINGVLATMTTDD290 pKa = 4.71DD291 pKa = 4.84YY292 pKa = 11.44NTMMDD297 pKa = 3.73EE298 pKa = 4.9AISVQPLSEE307 pKa = 3.96
Molecular weight: 32.09 kDa
Isoelectric point according different methods:
Protein with the highest isoelectric point:
>tr|D1PRN7|D1PRN7_9FIRM Ribonuclease P protein component OS=Subdoligranulum variabile DSM 15176 OX=411471 GN=rnpA PE=3 SV=1
MM1 pKa = 7.45KK2 pKa = 9.6RR3 pKa = 11.84TFQPKK8 pKa = 8.37KK9 pKa = 7.49RR10 pKa = 11.84QRR12 pKa = 11.84SRR14 pKa = 11.84VHH16 pKa = 6.45GFLQRR21 pKa = 11.84MSTKK25 pKa = 10.36NGRR28 pKa = 11.84KK29 pKa = 8.58VLARR33 pKa = 11.84RR34 pKa = 11.84RR35 pKa = 11.84AKK37 pKa = 10.04GRR39 pKa = 11.84KK40 pKa = 8.89SLTVV44 pKa = 3.12
MM1 pKa = 7.45KK2 pKa = 9.6RR3 pKa = 11.84TFQPKK8 pKa = 8.37KK9 pKa = 7.49RR10 pKa = 11.84QRR12 pKa = 11.84SRR14 pKa = 11.84VHH16 pKa = 6.45GFLQRR21 pKa = 11.84MSTKK25 pKa = 10.36NGRR28 pKa = 11.84KK29 pKa = 8.58VLARR33 pKa = 11.84RR34 pKa = 11.84RR35 pKa = 11.84AKK37 pKa = 10.04GRR39 pKa = 11.84KK40 pKa = 8.89SLTVV44 pKa = 3.12
Molecular weight: 5.28 kDa
Isoelectric point according different methods:
Peptides (in silico digests for buttom-up proteomics)
Below you can find in silico digests of the whole proteome with Trypsin, Chymotrypsin, Trypsin+LysC, LysN, ArgC proteases suitable for different mass spec machines.| Try ESI |
 |
|---|
| ChTry ESI |
 |
|---|
| ArgC ESI |
 |
|---|
| LysN ESI |
 |
|---|
| TryLysC ESI |
 |
|---|
| Try MALDI |
 |
|---|
| ChTry MALDI |
 |
|---|
| ArgC MALDI |
 |
|---|
| LysN MALDI |
 |
|---|
| TryLysC MALDI |
 |
|---|
| Try LTQ |
 |
|---|
| ChTry LTQ |
 |
|---|
| ArgC LTQ |
 |
|---|
| LysN LTQ |
 |
|---|
| TryLysC LTQ |
 |
|---|
| Try MSlow |
 |
|---|
| ChTry MSlow |
 |
|---|
| ArgC MSlow |
 |
|---|
| LysN MSlow |
 |
|---|
| TryLysC MSlow |
 |
|---|
| Try MShigh |
 |
|---|
| ChTry MShigh |
 |
|---|
| ArgC MShigh |
 |
|---|
| LysN MShigh |
 |
|---|
| TryLysC MShigh |
 |
|---|
General Statistics
Number of major isoforms |
Number of additional isoforms |
Number of all proteins |
Number of amino acids |
Min. Seq. Length |
Max. Seq. Length |
Avg. Seq. Length |
Avg. Mol. Weight |
|---|---|---|---|---|---|---|---|
0 |
991092 |
35 |
2992 |
293.4 |
32.42 |
Amino acid frequency
Ala |
Cys |
Asp |
Glu |
Phe |
Gly |
His |
Ile |
Lys |
Leu |
|---|---|---|---|---|---|---|---|---|---|
10.162 ± 0.051 | 1.767 ± 0.019 |
5.561 ± 0.04 | 6.214 ± 0.046 |
3.854 ± 0.029 | 7.635 ± 0.041 |
1.949 ± 0.021 | 5.29 ± 0.043 |
4.586 ± 0.045 | 10.161 ± 0.056 |
Met |
Asn |
Gln |
Pro |
Arg |
Ser |
Thr |
Val |
Trp |
Tyr |
|---|---|---|---|---|---|---|---|---|---|
2.684 ± 0.022 | 3.35 ± 0.027 |
4.414 ± 0.031 | 3.853 ± 0.029 |
5.61 ± 0.043 | 5.152 ± 0.033 |
5.848 ± 0.043 | 7.066 ± 0.034 |
1.199 ± 0.017 | 3.645 ± 0.029 |
Most of the basic statistics you can see at this page can be downloaded from this CSV file
Proteome-pI is available under Creative Commons Attribution-NoDerivs license, for more details see here
| Reference: Kozlowski LP. Proteome-pI 2.0: Proteome Isoelectric Point Database Update. Nucleic Acids Res. 2021, doi: 10.1093/nar/gkab944 | Contact: Lukasz P. Kozlowski |
