Pyrobaculum aerophilum (strain ATCC 51768 / IM2 / DSM 7523 / JCM 9630 / NBRC 100827)
Taxonomy: cellular organisms; Archaea; TACK group; Crenarchaeota; Thermoprotei; Thermoproteales; Thermoproteaceae; Pyrobaculum; Pyrobaculum aerophilum
Average proteome isoelectric point is 7.32
Get precalculated fractions of proteins
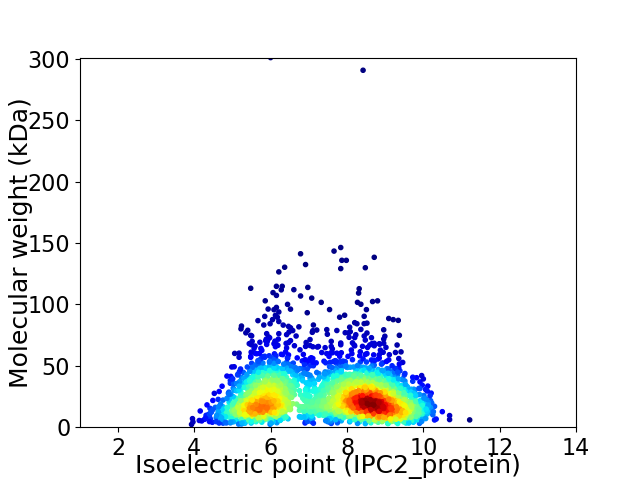
Virtual 2D-PAGE plot for 2590 proteins (isoelectric point calculated using IPC2_protein)
Get csv file with sequences according to given criteria:
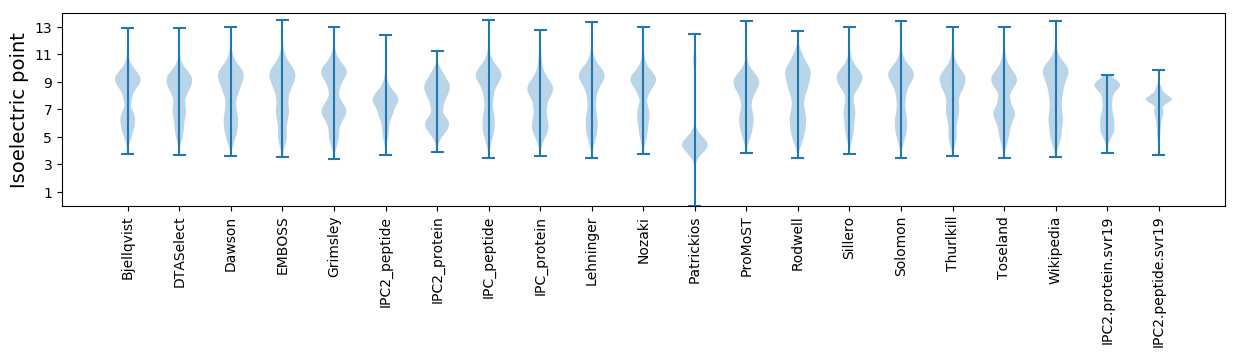
* You can choose from 21 different methods for calculating isoelectric point
Summary statistics related to proteome-wise predictions
Protein with the lowest isoelectric point:
>sp|Q8ZT04|PGP_PYRAE Phosphoglycolate phosphatase OS=Pyrobaculum aerophilum (strain ATCC 51768 / IM2 / DSM 7523 / JCM 9630 / NBRC 100827) OX=178306 GN=PAE3495 PE=3 SV=1
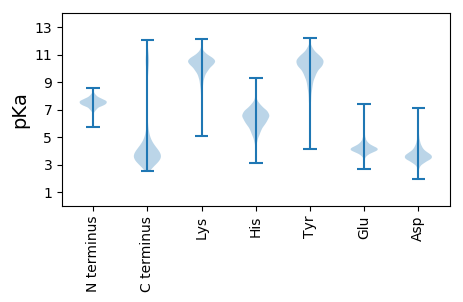
MM1 pKa = 7.99DD2 pKa = 5.19EE3 pKa = 4.44SYY5 pKa = 10.13IWPIVFVDD13 pKa = 3.13VDD15 pKa = 3.62RR16 pKa = 11.84NYY18 pKa = 11.72
MM1 pKa = 7.99DD2 pKa = 5.19EE3 pKa = 4.44SYY5 pKa = 10.13IWPIVFVDD13 pKa = 3.13VDD15 pKa = 3.62RR16 pKa = 11.84NYY18 pKa = 11.72
Molecular weight: 2.26 kDa
Isoelectric point according different methods:
Protein with the highest isoelectric point:
>tr|Q8ZTY7|Q8ZTY7_PYRAE Oligosaccharyl transferase OS=Pyrobaculum aerophilum (strain ATCC 51768 / IM2 / DSM 7523 / JCM 9630 / NBRC 100827) OX=178306 GN=PAE3030 PE=3 SV=1
MM1 pKa = 7.58ARR3 pKa = 11.84NKK5 pKa = 10.29PLGKK9 pKa = 10.05KK10 pKa = 9.73LRR12 pKa = 11.84LAAAFKK18 pKa = 9.46XNRR21 pKa = 11.84NPPVWVVVKK30 pKa = 8.44TKK32 pKa = 10.61RR33 pKa = 11.84RR34 pKa = 11.84VTRR37 pKa = 11.84SPARR41 pKa = 11.84RR42 pKa = 11.84HH43 pKa = 3.8WRR45 pKa = 11.84RR46 pKa = 11.84VKK48 pKa = 10.84LKK50 pKa = 10.56AA51 pKa = 3.65
MM1 pKa = 7.58ARR3 pKa = 11.84NKK5 pKa = 10.29PLGKK9 pKa = 10.05KK10 pKa = 9.73LRR12 pKa = 11.84LAAAFKK18 pKa = 9.46XNRR21 pKa = 11.84NPPVWVVVKK30 pKa = 8.44TKK32 pKa = 10.61RR33 pKa = 11.84RR34 pKa = 11.84VTRR37 pKa = 11.84SPARR41 pKa = 11.84RR42 pKa = 11.84HH43 pKa = 3.8WRR45 pKa = 11.84RR46 pKa = 11.84VKK48 pKa = 10.84LKK50 pKa = 10.56AA51 pKa = 3.65
Molecular weight: 5.94 kDa
Isoelectric point according different methods:
Peptides (in silico digests for buttom-up proteomics)
Below you can find in silico digests of the whole proteome with Trypsin, Chymotrypsin, Trypsin+LysC, LysN, ArgC proteases suitable for different mass spec machines.| Try ESI |
 |
|---|
| ChTry ESI |
|
|---|
| ArgC ESI |
|
|---|
| LysN ESI |
|
|---|
| TryLysC ESI |
|
|---|
| Try MALDI |
|
|---|
| ChTry MALDI |
|
|---|
| ArgC MALDI |
|
|---|
| LysN MALDI |
|
|---|
| TryLysC MALDI |
|
|---|
| Try LTQ |
|
|---|
| ChTry LTQ |
|
|---|
| ArgC LTQ |
|
|---|
| LysN LTQ |
|
|---|
| TryLysC LTQ |
|
|---|
| Try MSlow |
|
|---|
| ChTry MSlow |
|
|---|
| ArgC MSlow |
|
|---|
| LysN MSlow |
|
|---|
| TryLysC MSlow |
|
|---|
| Try MShigh |
|
|---|
| ChTry MShigh |
|
|---|
| ArgC MShigh |
|
|---|
| LysN MShigh |
|
|---|
| TryLysC MShigh |
|
|---|
General Statistics
Number of major isoforms |
Number of additional isoforms |
Number of all proteins |
Number of amino acids |
Min. Seq. Length |
Max. Seq. Length |
Avg. Seq. Length |
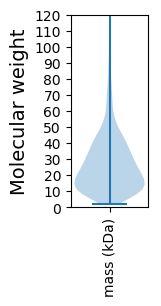
Avg. Mol. Weight |
|---|---|---|---|---|---|---|---|
0 |
654950 |
18 |
2785 |
252.9 |
28.1 |
Amino acid frequency
Ala |
Cys |
Asp |
Glu |
Phe |
Gly |
His |
Ile |
Lys |
Leu |
|---|---|---|---|---|---|---|---|---|---|
9.886 ± 0.073 | 0.871 ± 0.02 |
4.295 ± 0.036 | 6.995 ± 0.075 |
3.633 ± 0.025 | 7.676 ± 0.047 |
1.511 ± 0.019 | 6.293 ± 0.045 |
5.677 ± 0.045 | 10.568 ± 0.063 |
Met |
Asn |
Gln |
Pro |
Arg |
Ser |
Thr |
Val |
Trp |
Tyr |
|---|---|---|---|---|---|---|---|---|---|
1.926 ± 0.02 | 2.604 ± 0.033 |
4.988 ± 0.043 | 2.083 ± 0.025 |
6.546 ± 0.046 | 4.935 ± 0.038 |
4.407 ± 0.042 | 9.321 ± 0.054 |
1.474 ± 0.025 | 4.308 ± 0.035 |
Most of the basic statistics you can see at this page can be downloaded from this CSV file
See this proteome in:

Proteome-pI is available under Creative Commons Attribution-NoDerivs license, for more details see here
| Reference: Kozlowski LP. Proteome-pI 2.0: Proteome Isoelectric Point Database Update. Nucleic Acids Res. 2021, doi: 10.1093/nar/gkab944 | Contact: Lukasz P. Kozlowski |