Desulfosporosinus sp. Tol-M
Taxonomy: cellular organisms; Bacteria; Terrabacteria group; Firmicutes; Clostridia; Eubacteriales; Peptococcaceae; Desulfosporosinus; unclassified Desulfosporosinus
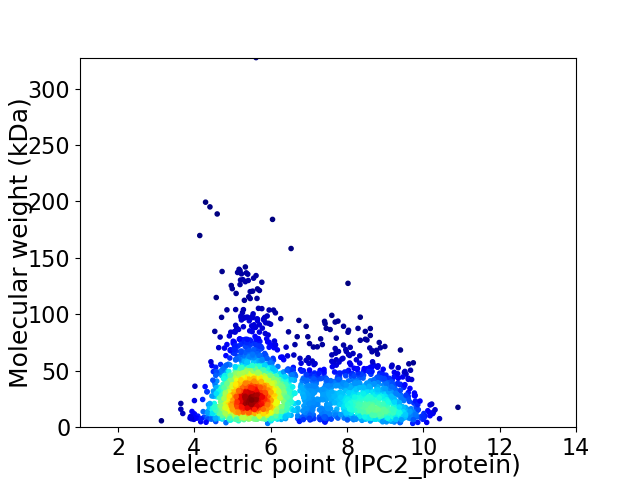
Average proteome isoelectric point is 6.48
Get precalculated fractions of proteins

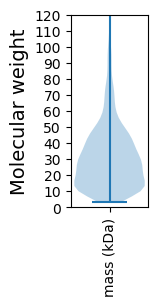
Virtual 2D-PAGE plot for 2539 proteins (isoelectric point calculated using IPC2_protein)
Get csv file with sequences according to given criteria:
* You can choose from 21 different methods for calculating isoelectric point
Summary statistics related to proteome-wise predictions


Protein with the lowest isoelectric point:
>tr|A0A0A2TL99|A0A0A2TL99_9FIRM Orotidine 5'-phosphate decarboxylase OS=Desulfosporosinus sp. Tol-M OX=1536651 GN=pyrF PE=3 SV=1
MM1 pKa = 6.99FAEE4 pKa = 4.26VDD6 pKa = 3.08KK7 pKa = 10.88DD8 pKa = 3.48ACIGCGACPDD18 pKa = 3.4ICPEE22 pKa = 3.82IFKK25 pKa = 11.1LEE27 pKa = 3.99EE28 pKa = 4.71DD29 pKa = 4.24EE30 pKa = 6.35LATAYY35 pKa = 10.24NNPVPRR41 pKa = 11.84DD42 pKa = 3.63FEE44 pKa = 4.36EE45 pKa = 4.35STKK48 pKa = 10.47EE49 pKa = 3.81AAEE52 pKa = 4.21SCPTEE57 pKa = 4.77AIHH60 pKa = 7.98LEE62 pKa = 4.24EE63 pKa = 4.35
MM1 pKa = 6.99FAEE4 pKa = 4.26VDD6 pKa = 3.08KK7 pKa = 10.88DD8 pKa = 3.48ACIGCGACPDD18 pKa = 3.4ICPEE22 pKa = 3.82IFKK25 pKa = 11.1LEE27 pKa = 3.99EE28 pKa = 4.71DD29 pKa = 4.24EE30 pKa = 6.35LATAYY35 pKa = 10.24NNPVPRR41 pKa = 11.84DD42 pKa = 3.63FEE44 pKa = 4.36EE45 pKa = 4.35STKK48 pKa = 10.47EE49 pKa = 3.81AAEE52 pKa = 4.21SCPTEE57 pKa = 4.77AIHH60 pKa = 7.98LEE62 pKa = 4.24EE63 pKa = 4.35
Molecular weight: 6.94 kDa
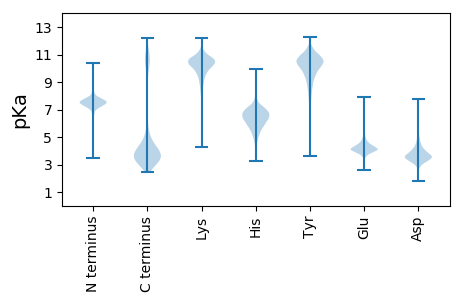
Isoelectric point according different methods:
Protein with the highest isoelectric point:
>tr|A0A0A2TH81|A0A0A2TH81_9FIRM Bac_transf domain-containing protein OS=Desulfosporosinus sp. Tol-M OX=1536651 GN=JT05_11160 PE=3 SV=1
MM1 pKa = 7.57RR2 pKa = 11.84VLAFLLAMILLLLIGLALKK21 pKa = 10.95AEE23 pKa = 3.86VDD25 pKa = 3.81FRR27 pKa = 11.84YY28 pKa = 10.19RR29 pKa = 11.84RR30 pKa = 11.84IEE32 pKa = 4.05EE33 pKa = 3.99EE34 pKa = 3.78DD35 pKa = 3.62HH36 pKa = 8.35IEE38 pKa = 3.44IDD40 pKa = 3.52FRR42 pKa = 11.84AFHH45 pKa = 6.18GLWHH49 pKa = 6.55IQYY52 pKa = 9.98QIPTLQLEE60 pKa = 4.63WEE62 pKa = 4.5KK63 pKa = 11.22GPEE66 pKa = 3.84VEE68 pKa = 4.44MEE70 pKa = 3.89QVAITKK76 pKa = 10.35GGTRR80 pKa = 11.84QTTKK84 pKa = 10.26KK85 pKa = 10.64ARR87 pKa = 11.84IRR89 pKa = 11.84YY90 pKa = 8.35IRR92 pKa = 11.84RR93 pKa = 11.84GWLSRR98 pKa = 11.84FWPNVPRR105 pKa = 11.84LLRR108 pKa = 11.84HH109 pKa = 6.39IYY111 pKa = 9.59RR112 pKa = 11.84VKK114 pKa = 8.8QQFYY118 pKa = 10.96RR119 pKa = 11.84GIHH122 pKa = 5.8CKK124 pKa = 10.28AINWRR129 pKa = 11.84IEE131 pKa = 3.88IGCQDD136 pKa = 3.56AAQTAIAAGAFWTMFGFALSRR157 pKa = 11.84LYY159 pKa = 10.68RR160 pKa = 11.84QVTVEE165 pKa = 4.01VSSPALVVIPRR176 pKa = 11.84FKK178 pKa = 10.82KK179 pKa = 10.51AGFLCDD185 pKa = 4.04LQCIFQLRR193 pKa = 11.84ISHH196 pKa = 7.02IIFGGFNVLRR206 pKa = 11.84IIRR209 pKa = 11.84RR210 pKa = 11.84GIRR213 pKa = 11.84GG214 pKa = 3.22
MM1 pKa = 7.57RR2 pKa = 11.84VLAFLLAMILLLLIGLALKK21 pKa = 10.95AEE23 pKa = 3.86VDD25 pKa = 3.81FRR27 pKa = 11.84YY28 pKa = 10.19RR29 pKa = 11.84RR30 pKa = 11.84IEE32 pKa = 4.05EE33 pKa = 3.99EE34 pKa = 3.78DD35 pKa = 3.62HH36 pKa = 8.35IEE38 pKa = 3.44IDD40 pKa = 3.52FRR42 pKa = 11.84AFHH45 pKa = 6.18GLWHH49 pKa = 6.55IQYY52 pKa = 9.98QIPTLQLEE60 pKa = 4.63WEE62 pKa = 4.5KK63 pKa = 11.22GPEE66 pKa = 3.84VEE68 pKa = 4.44MEE70 pKa = 3.89QVAITKK76 pKa = 10.35GGTRR80 pKa = 11.84QTTKK84 pKa = 10.26KK85 pKa = 10.64ARR87 pKa = 11.84IRR89 pKa = 11.84YY90 pKa = 8.35IRR92 pKa = 11.84RR93 pKa = 11.84GWLSRR98 pKa = 11.84FWPNVPRR105 pKa = 11.84LLRR108 pKa = 11.84HH109 pKa = 6.39IYY111 pKa = 9.59RR112 pKa = 11.84VKK114 pKa = 8.8QQFYY118 pKa = 10.96RR119 pKa = 11.84GIHH122 pKa = 5.8CKK124 pKa = 10.28AINWRR129 pKa = 11.84IEE131 pKa = 3.88IGCQDD136 pKa = 3.56AAQTAIAAGAFWTMFGFALSRR157 pKa = 11.84LYY159 pKa = 10.68RR160 pKa = 11.84QVTVEE165 pKa = 4.01VSSPALVVIPRR176 pKa = 11.84FKK178 pKa = 10.82KK179 pKa = 10.51AGFLCDD185 pKa = 4.04LQCIFQLRR193 pKa = 11.84ISHH196 pKa = 7.02IIFGGFNVLRR206 pKa = 11.84IIRR209 pKa = 11.84RR210 pKa = 11.84GIRR213 pKa = 11.84GG214 pKa = 3.22
Molecular weight: 25.13 kDa
Isoelectric point according different methods:
Peptides (in silico digests for buttom-up proteomics)
Below you can find in silico digests of the whole proteome with Trypsin, Chymotrypsin, Trypsin+LysC, LysN, ArgC proteases suitable for different mass spec machines.| Try ESI |
 |
|---|
| ChTry ESI |
 |
|---|
| ArgC ESI |
 |
|---|
| LysN ESI |
 |
|---|
| TryLysC ESI |
 |
|---|
| Try MALDI |
 |
|---|
| ChTry MALDI |
 |
|---|
| ArgC MALDI |
 |
|---|
| LysN MALDI |
 |
|---|
| TryLysC MALDI |
 |
|---|
| Try LTQ |
 |
|---|
| ChTry LTQ |
 |
|---|
| ArgC LTQ |
 |
|---|
| LysN LTQ |
 |
|---|
| TryLysC LTQ |
 |
|---|
| Try MSlow |
 |
|---|
| ChTry MSlow |
 |
|---|
| ArgC MSlow |
 |
|---|
| LysN MSlow |
 |
|---|
| TryLysC MSlow |
 |
|---|
| Try MShigh |
 |
|---|
| ChTry MShigh |
 |
|---|
| ArgC MShigh |
 |
|---|
| LysN MShigh |
 |
|---|
| TryLysC MShigh |
 |
|---|
General Statistics
Number of major isoforms |
Number of additional isoforms |
Number of all proteins |
Number of amino acids |
Min. Seq. Length |
Max. Seq. Length |
Avg. Seq. Length |
Avg. Mol. Weight |
|---|---|---|---|---|---|---|---|
0 |
749546 |
31 |
2876 |
295.2 |
32.94 |
Amino acid frequency
Ala |
Cys |
Asp |
Glu |
Phe |
Gly |
His |
Ile |
Lys |
Leu |
|---|---|---|---|---|---|---|---|---|---|
7.708 ± 0.048 | 1.145 ± 0.022 |
5.065 ± 0.038 | 6.945 ± 0.05 |
4.009 ± 0.035 | 7.367 ± 0.044 |
1.885 ± 0.024 | 7.362 ± 0.048 |
6.061 ± 0.044 | 10.292 ± 0.061 |
Met |
Asn |
Gln |
Pro |
Arg |
Ser |
Thr |
Val |
Trp |
Tyr |
|---|---|---|---|---|---|---|---|---|---|
2.521 ± 0.022 | 4.081 ± 0.037 |
3.989 ± 0.033 | 3.796 ± 0.032 |
5.129 ± 0.038 | 5.799 ± 0.034 |
5.377 ± 0.041 | 7.069 ± 0.048 |
1.06 ± 0.017 | 3.337 ± 0.036 |
Most of the basic statistics you can see at this page can be downloaded from this CSV file
Proteome-pI is available under Creative Commons Attribution-NoDerivs license, for more details see here
| Reference: Kozlowski LP. Proteome-pI 2.0: Proteome Isoelectric Point Database Update. Nucleic Acids Res. 2021, doi: 10.1093/nar/gkab944 | Contact: Lukasz P. Kozlowski |
