Actinoplanes sp. (strain ATCC 31044 / CBS 674.73 / SE50/110)
Taxonomy: cellular organisms; Bacteria; Terrabacteria group; Actinobacteria; Actinomycetia; Micromonosporales; Micromonosporaceae; Actinoplanes; unclassified Actinoplanes
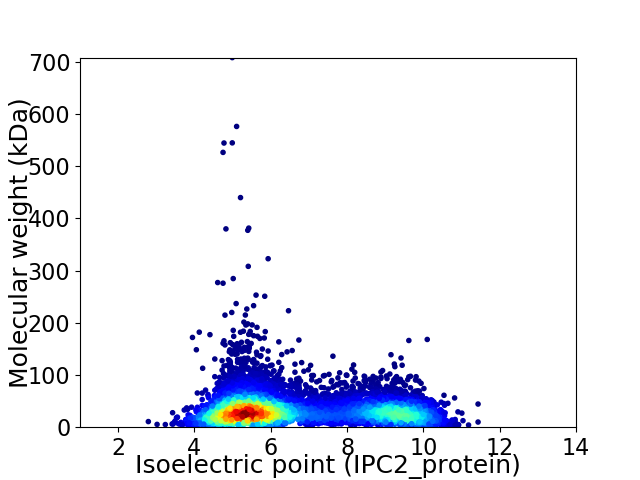
Average proteome isoelectric point is 6.62
Get precalculated fractions of proteins

Virtual 2D-PAGE plot for 8249 proteins (isoelectric point calculated using IPC2_protein)
Get csv file with sequences according to given criteria:
* You can choose from 21 different methods for calculating isoelectric point
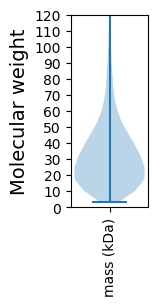
Summary statistics related to proteome-wise predictions


Protein with the lowest isoelectric point:
>tr|G8SBS3|G8SBS3_ACTS5 Ornithine cyclodeaminase OS=Actinoplanes sp. (strain ATCC 31044 / CBS 674.73 / SE50/110) OX=134676 GN=ACPL_4372 PE=4 SV=1
MM1 pKa = 7.54SDD3 pKa = 2.44HH4 pKa = 6.83WGGFDD9 pKa = 3.42HH10 pKa = 7.36HH11 pKa = 7.88DD12 pKa = 4.43DD13 pKa = 4.7GGDD16 pKa = 3.11HH17 pKa = 6.92HH18 pKa = 8.1LPDD21 pKa = 5.32FDD23 pKa = 6.04DD24 pKa = 4.15SHH26 pKa = 7.21DD27 pKa = 4.04LPAGHH32 pKa = 7.71DD33 pKa = 3.8LTDD36 pKa = 3.37MSDD39 pKa = 2.95LHH41 pKa = 6.9DD42 pKa = 3.85QHH44 pKa = 8.14DD45 pKa = 4.41HH46 pKa = 7.66DD47 pKa = 6.45DD48 pKa = 4.36PGHH51 pKa = 7.34DD52 pKa = 4.82DD53 pKa = 3.42AHH55 pKa = 7.8HH56 pKa = 7.81DD57 pKa = 4.23DD58 pKa = 4.25AQHH61 pKa = 7.31DD62 pKa = 3.76IAEE65 pKa = 4.64IPDD68 pKa = 3.61THH70 pKa = 7.16HH71 pKa = 7.54DD72 pKa = 3.97PVALTDD78 pKa = 4.39DD79 pKa = 4.86FPPHH83 pKa = 7.42LEE85 pKa = 4.0VGEE88 pKa = 4.22LPEE91 pKa = 4.66PVDD94 pKa = 3.62GFPWTDD100 pKa = 2.91AATLGHH106 pKa = 6.79AAAYY110 pKa = 7.73TPTTDD115 pKa = 4.01PVDD118 pKa = 3.76PHH120 pKa = 7.51DD121 pKa = 4.04LAAYY125 pKa = 9.82AGLDD129 pKa = 3.57VPEE132 pKa = 5.7GSDD135 pKa = 2.78PWTALTASDD144 pKa = 4.85DD145 pKa = 4.02PAISALARR153 pKa = 11.84WWTPDD158 pKa = 3.17EE159 pKa = 4.11QQ160 pKa = 4.59
MM1 pKa = 7.54SDD3 pKa = 2.44HH4 pKa = 6.83WGGFDD9 pKa = 3.42HH10 pKa = 7.36HH11 pKa = 7.88DD12 pKa = 4.43DD13 pKa = 4.7GGDD16 pKa = 3.11HH17 pKa = 6.92HH18 pKa = 8.1LPDD21 pKa = 5.32FDD23 pKa = 6.04DD24 pKa = 4.15SHH26 pKa = 7.21DD27 pKa = 4.04LPAGHH32 pKa = 7.71DD33 pKa = 3.8LTDD36 pKa = 3.37MSDD39 pKa = 2.95LHH41 pKa = 6.9DD42 pKa = 3.85QHH44 pKa = 8.14DD45 pKa = 4.41HH46 pKa = 7.66DD47 pKa = 6.45DD48 pKa = 4.36PGHH51 pKa = 7.34DD52 pKa = 4.82DD53 pKa = 3.42AHH55 pKa = 7.8HH56 pKa = 7.81DD57 pKa = 4.23DD58 pKa = 4.25AQHH61 pKa = 7.31DD62 pKa = 3.76IAEE65 pKa = 4.64IPDD68 pKa = 3.61THH70 pKa = 7.16HH71 pKa = 7.54DD72 pKa = 3.97PVALTDD78 pKa = 4.39DD79 pKa = 4.86FPPHH83 pKa = 7.42LEE85 pKa = 4.0VGEE88 pKa = 4.22LPEE91 pKa = 4.66PVDD94 pKa = 3.62GFPWTDD100 pKa = 2.91AATLGHH106 pKa = 6.79AAAYY110 pKa = 7.73TPTTDD115 pKa = 4.01PVDD118 pKa = 3.76PHH120 pKa = 7.51DD121 pKa = 4.04LAAYY125 pKa = 9.82AGLDD129 pKa = 3.57VPEE132 pKa = 5.7GSDD135 pKa = 2.78PWTALTASDD144 pKa = 4.85DD145 pKa = 4.02PAISALARR153 pKa = 11.84WWTPDD158 pKa = 3.17EE159 pKa = 4.11QQ160 pKa = 4.59
Molecular weight: 17.46 kDa
Isoelectric point according different methods:
Protein with the highest isoelectric point:
>tr|G8S7L1|G8S7L1_ACTS5 Putative hydrolase OS=Actinoplanes sp. (strain ATCC 31044 / CBS 674.73 / SE50/110) OX=134676 GN=ACPL_7893 PE=4 SV=1
MM1 pKa = 6.91VAIAGRR7 pKa = 11.84RR8 pKa = 11.84RR9 pKa = 11.84QAVMAIFGRR18 pKa = 11.84RR19 pKa = 11.84RR20 pKa = 11.84QAVMAIFGQRR30 pKa = 11.84RR31 pKa = 11.84QVVMAIAGRR40 pKa = 11.84RR41 pKa = 11.84LPPVMVIAGRR51 pKa = 11.84RR52 pKa = 11.84HH53 pKa = 4.29QAVMAMVSAPAATSTPAHH71 pKa = 6.04NRR73 pKa = 11.84STLNQARR80 pKa = 11.84RR81 pKa = 11.84RR82 pKa = 11.84MFTPRR87 pKa = 11.84NSS89 pKa = 3.1
MM1 pKa = 6.91VAIAGRR7 pKa = 11.84RR8 pKa = 11.84RR9 pKa = 11.84QAVMAIFGRR18 pKa = 11.84RR19 pKa = 11.84RR20 pKa = 11.84QAVMAIFGQRR30 pKa = 11.84RR31 pKa = 11.84QVVMAIAGRR40 pKa = 11.84RR41 pKa = 11.84LPPVMVIAGRR51 pKa = 11.84RR52 pKa = 11.84HH53 pKa = 4.29QAVMAMVSAPAATSTPAHH71 pKa = 6.04NRR73 pKa = 11.84STLNQARR80 pKa = 11.84RR81 pKa = 11.84RR82 pKa = 11.84MFTPRR87 pKa = 11.84NSS89 pKa = 3.1
Molecular weight: 9.89 kDa
Isoelectric point according different methods:
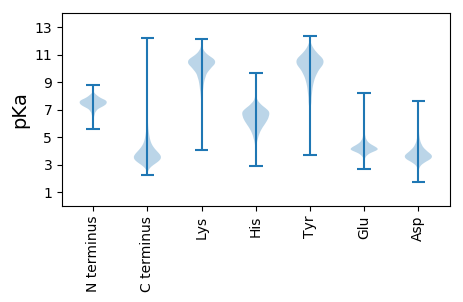
Peptides (in silico digests for buttom-up proteomics)
Below you can find in silico digests of the whole proteome with Trypsin, Chymotrypsin, Trypsin+LysC, LysN, ArgC proteases suitable for different mass spec machines.| Try ESI |
 |
|---|
| ChTry ESI |
 |
|---|
| ArgC ESI |
 |
|---|
| LysN ESI |
 |
|---|
| TryLysC ESI |
 |
|---|
| Try MALDI |
 |
|---|
| ChTry MALDI |
 |
|---|
| ArgC MALDI |
 |
|---|
| LysN MALDI |
 |
|---|
| TryLysC MALDI |
 |
|---|
| Try LTQ |
 |
|---|
| ChTry LTQ |
 |
|---|
| ArgC LTQ |
 |
|---|
| LysN LTQ |
 |
|---|
| TryLysC LTQ |
 |
|---|
| Try MSlow |
 |
|---|
| ChTry MSlow |
 |
|---|
| ArgC MSlow |
 |
|---|
| LysN MSlow |
 |
|---|
| TryLysC MSlow |
 |
|---|
| Try MShigh |
 |
|---|
| ChTry MShigh |
 |
|---|
| ArgC MShigh |
 |
|---|
| LysN MShigh |
 |
|---|
| TryLysC MShigh |
 |
|---|
General Statistics
Number of major isoforms |
Number of additional isoforms |
Number of all proteins |
Number of amino acids |
Min. Seq. Length |
Max. Seq. Length |
Avg. Seq. Length |
Avg. Mol. Weight |
|---|---|---|---|---|---|---|---|
0 |
2710578 |
30 |
6598 |
328.6 |
35.04 |
Amino acid frequency
Ala |
Cys |
Asp |
Glu |
Phe |
Gly |
His |
Ile |
Lys |
Leu |
|---|---|---|---|---|---|---|---|---|---|
14.323 ± 0.049 | 0.744 ± 0.007 |
6.054 ± 0.024 | 4.775 ± 0.025 |
2.718 ± 0.016 | 9.335 ± 0.037 |
2.198 ± 0.015 | 3.587 ± 0.018 |
1.775 ± 0.02 | 10.34 ± 0.042 |
Met |
Asn |
Gln |
Pro |
Arg |
Ser |
Thr |
Val |
Trp |
Tyr |
|---|---|---|---|---|---|---|---|---|---|
1.692 ± 0.011 | 1.867 ± 0.017 |
6.174 ± 0.031 | 2.831 ± 0.017 |
8.144 ± 0.032 | 4.911 ± 0.025 |
6.417 ± 0.034 | 8.511 ± 0.027 |
1.569 ± 0.011 | 2.035 ± 0.015 |
Most of the basic statistics you can see at this page can be downloaded from this CSV file
Proteome-pI is available under Creative Commons Attribution-NoDerivs license, for more details see here
| Reference: Kozlowski LP. Proteome-pI 2.0: Proteome Isoelectric Point Database Update. Nucleic Acids Res. 2021, doi: 10.1093/nar/gkab944 | Contact: Lukasz P. Kozlowski |
