Catenovulum sp. CCB-QB4
Taxonomy: cellular organisms; Bacteria; Proteobacteria; Gammaproteobacteria; Alteromonadales; Alteromonadaceae; Catenovulum; unclassified Catenovulum
Average proteome isoelectric point is 6.26
Get precalculated fractions of proteins

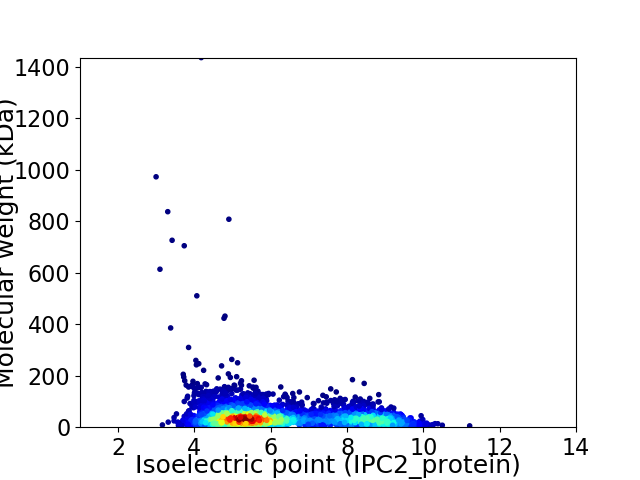
Virtual 2D-PAGE plot for 4272 proteins (isoelectric point calculated using IPC2_protein)
Get csv file with sequences according to given criteria:
* You can choose from 21 different methods for calculating isoelectric point
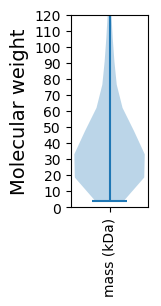
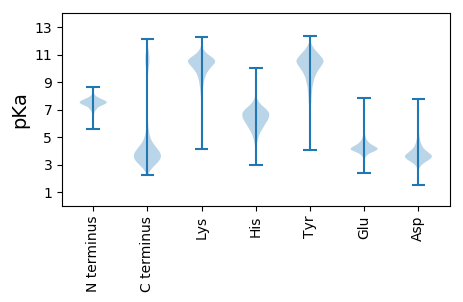
Summary statistics related to proteome-wise predictions


Protein with the lowest isoelectric point:
>tr|A0A2S0VQN9|A0A2S0VQN9_9ALTE Uncharacterized protein OS=Catenovulum sp. CCB-QB4 OX=2172099 GN=C2869_08845 PE=4 SV=1
MM1 pKa = 7.7KK2 pKa = 8.78FTNMAKK8 pKa = 10.44AGVLAAALTAPMANADD24 pKa = 4.21MLYY27 pKa = 10.54GIYY30 pKa = 9.92IGAQGWQTSADD41 pKa = 3.29GSFGQDD47 pKa = 3.14AKK49 pKa = 11.19DD50 pKa = 3.37SSATFDD56 pKa = 4.42FDD58 pKa = 5.7DD59 pKa = 3.82KK60 pKa = 11.02TSTSFYY66 pKa = 10.75VALEE70 pKa = 3.98HH71 pKa = 7.1PIPLVPNIKK80 pKa = 9.52VRR82 pKa = 11.84QNDD85 pKa = 3.27IEE87 pKa = 4.35IEE89 pKa = 4.12GSINGQYY96 pKa = 11.35DD97 pKa = 3.84FFGKK101 pKa = 9.1TYY103 pKa = 10.12TSQTTTDD110 pKa = 3.25AKK112 pKa = 10.11LTNTDD117 pKa = 4.24FILYY121 pKa = 9.85YY122 pKa = 10.48EE123 pKa = 4.63ILDD126 pKa = 3.92NDD128 pKa = 4.65LVSLDD133 pKa = 3.4IGFNGKK139 pKa = 10.13KK140 pKa = 9.26IDD142 pKa = 3.8GEE144 pKa = 4.41LFVDD148 pKa = 5.41DD149 pKa = 4.6SVEE152 pKa = 4.25DD153 pKa = 3.77STTKK157 pKa = 10.03TFSGVVPMLYY167 pKa = 10.37GAASVGLPLTGLSVYY182 pKa = 11.32ADD184 pKa = 3.74MSYY187 pKa = 11.08VGYY190 pKa = 10.57DD191 pKa = 3.55GNSLSDD197 pKa = 3.64FNAGIQYY204 pKa = 10.24EE205 pKa = 4.57VIDD208 pKa = 4.27VVAADD213 pKa = 4.19LAVQLGYY220 pKa = 10.81RR221 pKa = 11.84SFALEE226 pKa = 5.21LDD228 pKa = 4.19DD229 pKa = 6.73LDD231 pKa = 7.1DD232 pKa = 4.69IDD234 pKa = 4.39TDD236 pKa = 4.29FDD238 pKa = 4.08VSGAYY243 pKa = 10.09VGVQLHH249 pKa = 5.91FF250 pKa = 4.32
MM1 pKa = 7.7KK2 pKa = 8.78FTNMAKK8 pKa = 10.44AGVLAAALTAPMANADD24 pKa = 4.21MLYY27 pKa = 10.54GIYY30 pKa = 9.92IGAQGWQTSADD41 pKa = 3.29GSFGQDD47 pKa = 3.14AKK49 pKa = 11.19DD50 pKa = 3.37SSATFDD56 pKa = 4.42FDD58 pKa = 5.7DD59 pKa = 3.82KK60 pKa = 11.02TSTSFYY66 pKa = 10.75VALEE70 pKa = 3.98HH71 pKa = 7.1PIPLVPNIKK80 pKa = 9.52VRR82 pKa = 11.84QNDD85 pKa = 3.27IEE87 pKa = 4.35IEE89 pKa = 4.12GSINGQYY96 pKa = 11.35DD97 pKa = 3.84FFGKK101 pKa = 9.1TYY103 pKa = 10.12TSQTTTDD110 pKa = 3.25AKK112 pKa = 10.11LTNTDD117 pKa = 4.24FILYY121 pKa = 9.85YY122 pKa = 10.48EE123 pKa = 4.63ILDD126 pKa = 3.92NDD128 pKa = 4.65LVSLDD133 pKa = 3.4IGFNGKK139 pKa = 10.13KK140 pKa = 9.26IDD142 pKa = 3.8GEE144 pKa = 4.41LFVDD148 pKa = 5.41DD149 pKa = 4.6SVEE152 pKa = 4.25DD153 pKa = 3.77STTKK157 pKa = 10.03TFSGVVPMLYY167 pKa = 10.37GAASVGLPLTGLSVYY182 pKa = 11.32ADD184 pKa = 3.74MSYY187 pKa = 11.08VGYY190 pKa = 10.57DD191 pKa = 3.55GNSLSDD197 pKa = 3.64FNAGIQYY204 pKa = 10.24EE205 pKa = 4.57VIDD208 pKa = 4.27VVAADD213 pKa = 4.19LAVQLGYY220 pKa = 10.81RR221 pKa = 11.84SFALEE226 pKa = 5.21LDD228 pKa = 4.19DD229 pKa = 6.73LDD231 pKa = 7.1DD232 pKa = 4.69IDD234 pKa = 4.39TDD236 pKa = 4.29FDD238 pKa = 4.08VSGAYY243 pKa = 10.09VGVQLHH249 pKa = 5.91FF250 pKa = 4.32
Molecular weight: 27.04 kDa
Isoelectric point according different methods:
Protein with the highest isoelectric point:
>tr|A0A2S0VQI0|A0A2S0VQI0_9ALTE Uncharacterized protein OS=Catenovulum sp. CCB-QB4 OX=2172099 GN=C2869_08560 PE=3 SV=1
MM1 pKa = 7.45KK2 pKa = 9.61RR3 pKa = 11.84TFQPSNLKK11 pKa = 10.2RR12 pKa = 11.84KK13 pKa = 7.57RR14 pKa = 11.84THH16 pKa = 5.9GFRR19 pKa = 11.84ARR21 pKa = 11.84MATKK25 pKa = 10.37NGRR28 pKa = 11.84KK29 pKa = 8.96VLARR33 pKa = 11.84RR34 pKa = 11.84RR35 pKa = 11.84AKK37 pKa = 9.94GRR39 pKa = 11.84KK40 pKa = 8.67VLSAA44 pKa = 4.05
MM1 pKa = 7.45KK2 pKa = 9.61RR3 pKa = 11.84TFQPSNLKK11 pKa = 10.2RR12 pKa = 11.84KK13 pKa = 7.57RR14 pKa = 11.84THH16 pKa = 5.9GFRR19 pKa = 11.84ARR21 pKa = 11.84MATKK25 pKa = 10.37NGRR28 pKa = 11.84KK29 pKa = 8.96VLARR33 pKa = 11.84RR34 pKa = 11.84RR35 pKa = 11.84AKK37 pKa = 9.94GRR39 pKa = 11.84KK40 pKa = 8.67VLSAA44 pKa = 4.05
Molecular weight: 5.17 kDa
Isoelectric point according different methods:
Peptides (in silico digests for buttom-up proteomics)
Below you can find in silico digests of the whole proteome with Trypsin, Chymotrypsin, Trypsin+LysC, LysN, ArgC proteases suitable for different mass spec machines.| Try ESI |
 |
|---|
| ChTry ESI |
 |
|---|
| ArgC ESI |
 |
|---|
| LysN ESI |
 |
|---|
| TryLysC ESI |
 |
|---|
| Try MALDI |
 |
|---|
| ChTry MALDI |
 |
|---|
| ArgC MALDI |
 |
|---|
| LysN MALDI |
 |
|---|
| TryLysC MALDI |
 |
|---|
| Try LTQ |
 |
|---|
| ChTry LTQ |
 |
|---|
| ArgC LTQ |
 |
|---|
| LysN LTQ |
 |
|---|
| TryLysC LTQ |
 |
|---|
| Try MSlow |
 |
|---|
| ChTry MSlow |
 |
|---|
| ArgC MSlow |
 |
|---|
| LysN MSlow |
 |
|---|
| TryLysC MSlow |
 |
|---|
| Try MShigh |
 |
|---|
| ChTry MShigh |
 |
|---|
| ArgC MShigh |
 |
|---|
| LysN MShigh |
 |
|---|
| TryLysC MShigh |
 |
|---|
General Statistics
Number of major isoforms |
Number of additional isoforms |
Number of all proteins |
Number of amino acids |
Min. Seq. Length |
Max. Seq. Length |
Avg. Seq. Length |
Avg. Mol. Weight |
|---|---|---|---|---|---|---|---|
0 |
1643176 |
33 |
13215 |
384.6 |
42.81 |
Amino acid frequency
Ala |
Cys |
Asp |
Glu |
Phe |
Gly |
His |
Ile |
Lys |
Leu |
|---|---|---|---|---|---|---|---|---|---|
8.515 ± 0.043 | 0.934 ± 0.016 |
6.016 ± 0.061 | 5.689 ± 0.036 |
4.173 ± 0.024 | 6.47 ± 0.043 |
2.202 ± 0.023 | 6.294 ± 0.026 |
5.531 ± 0.058 | 9.875 ± 0.059 |
Met |
Asn |
Gln |
Pro |
Arg |
Ser |
Thr |
Val |
Trp |
Tyr |
|---|---|---|---|---|---|---|---|---|---|
2.118 ± 0.028 | 5.176 ± 0.038 |
3.772 ± 0.024 | 5.42 ± 0.049 |
3.969 ± 0.041 | 6.775 ± 0.066 |
5.715 ± 0.074 | 6.677 ± 0.042 |
1.303 ± 0.019 | 3.375 ± 0.025 |
Most of the basic statistics you can see at this page can be downloaded from this CSV file
Proteome-pI is available under Creative Commons Attribution-NoDerivs license, for more details see here
| Reference: Kozlowski LP. Proteome-pI 2.0: Proteome Isoelectric Point Database Update. Nucleic Acids Res. 2021, doi: 10.1093/nar/gkab944 | Contact: Lukasz P. Kozlowski |
