Desulfosporosinus sp. I2
Taxonomy: cellular organisms; Bacteria; Terrabacteria group; Firmicutes; Clostridia; Eubacteriales; Peptococcaceae; Desulfosporosinus; unclassified Desulfosporosinus
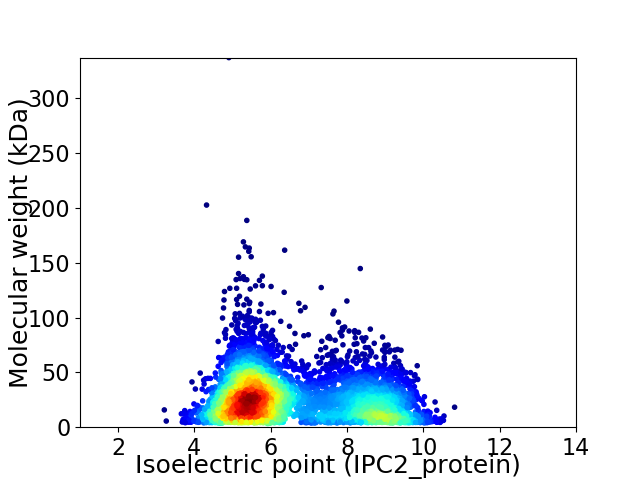
Average proteome isoelectric point is 6.51
Get precalculated fractions of proteins

Virtual 2D-PAGE plot for 5500 proteins (isoelectric point calculated using IPC2_protein)
Get csv file with sequences according to given criteria:
* You can choose from 21 different methods for calculating isoelectric point
Summary statistics related to proteome-wise predictions


Protein with the lowest isoelectric point:
>tr|A0A0F2JAW2|A0A0F2JAW2_9FIRM Stage V sporulation protein AD (SpoVAD) OS=Desulfosporosinus sp. I2 OX=1617025 GN=UF75_3562 PE=4 SV=1
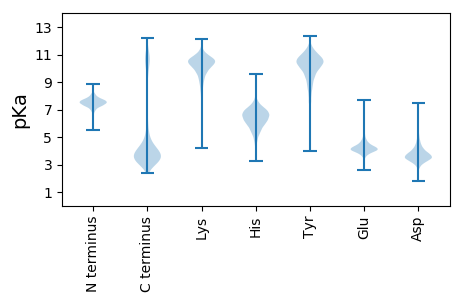
MM1 pKa = 7.47AAFGYY6 pKa = 10.52VYY8 pKa = 10.32TLDD11 pKa = 4.21AVAQVVAGGADD22 pKa = 3.34VLFSSNGPLVNEE34 pKa = 3.65VHH36 pKa = 6.7IAGTAPVTVALAGNYY51 pKa = 9.72QIDD54 pKa = 4.01YY55 pKa = 9.91SVSITAGVGSEE66 pKa = 3.64IAIAVNGVVDD76 pKa = 4.65PSTPITALVATGQVPGQAILTLAAGDD102 pKa = 4.15VITLRR107 pKa = 11.84NSSAVPFTLTTAPEE121 pKa = 3.91VGAQLTIDD129 pKa = 4.06KK130 pKa = 10.77LDD132 pKa = 3.29
MM1 pKa = 7.47AAFGYY6 pKa = 10.52VYY8 pKa = 10.32TLDD11 pKa = 4.21AVAQVVAGGADD22 pKa = 3.34VLFSSNGPLVNEE34 pKa = 3.65VHH36 pKa = 6.7IAGTAPVTVALAGNYY51 pKa = 9.72QIDD54 pKa = 4.01YY55 pKa = 9.91SVSITAGVGSEE66 pKa = 3.64IAIAVNGVVDD76 pKa = 4.65PSTPITALVATGQVPGQAILTLAAGDD102 pKa = 4.15VITLRR107 pKa = 11.84NSSAVPFTLTTAPEE121 pKa = 3.91VGAQLTIDD129 pKa = 4.06KK130 pKa = 10.77LDD132 pKa = 3.29
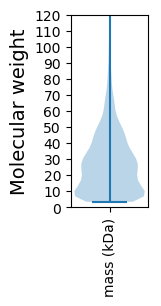
Molecular weight: 13.14 kDa
Isoelectric point according different methods:
Protein with the highest isoelectric point:
>tr|A0A0F2JDC2|A0A0F2JDC2_9FIRM Site-specific recombinase OS=Desulfosporosinus sp. I2 OX=1617025 GN=UF75_3451 PE=4 SV=1
MM1 pKa = 7.41ILRR4 pKa = 11.84RR5 pKa = 11.84KK6 pKa = 10.12SEE8 pKa = 3.79VLIRR12 pKa = 11.84SVSEE16 pKa = 3.91NPSRR20 pKa = 11.84GPLTIDD26 pKa = 3.33SVIGSVTPRR35 pKa = 11.84LAHH38 pKa = 6.53PLAPITIASVKK49 pKa = 10.06SPKK52 pKa = 10.48KK53 pKa = 7.95MTEE56 pKa = 3.75SPEE59 pKa = 4.15RR60 pKa = 11.84MASTASPILDD70 pKa = 3.08IFFISRR76 pKa = 11.84PGSRR80 pKa = 11.84LWIVISTTFDD90 pKa = 3.15NFTCASSGCPGKK102 pKa = 9.48STIRR106 pKa = 11.84GLRR109 pKa = 11.84INWSSRR115 pKa = 11.84FLSTSPSTATTIQGIRR131 pKa = 11.84SFPWRR136 pKa = 11.84EE137 pKa = 3.36NSRR140 pKa = 11.84NTTSLLLDD148 pKa = 4.4KK149 pKa = 10.86ISFTFFPDD157 pKa = 2.66KK158 pKa = 11.28GFFKK162 pKa = 10.75SSSNEE167 pKa = 3.59YY168 pKa = 10.34EE169 pKa = 3.65GDD171 pKa = 3.32FRR173 pKa = 11.84IFRR176 pKa = 11.84SPFGRR181 pKa = 11.84MVSSLIIFIQLGIVVSSDD199 pKa = 2.56LAYY202 pKa = 10.18FVRR205 pKa = 11.84QRR207 pKa = 11.84VDD209 pKa = 3.01YY210 pKa = 10.88SPVLGSLLYY219 pKa = 10.22SAKK222 pKa = 10.27QNPLPPHH229 pKa = 5.42FSIRR233 pKa = 11.84IRR235 pKa = 3.53
MM1 pKa = 7.41ILRR4 pKa = 11.84RR5 pKa = 11.84KK6 pKa = 10.12SEE8 pKa = 3.79VLIRR12 pKa = 11.84SVSEE16 pKa = 3.91NPSRR20 pKa = 11.84GPLTIDD26 pKa = 3.33SVIGSVTPRR35 pKa = 11.84LAHH38 pKa = 6.53PLAPITIASVKK49 pKa = 10.06SPKK52 pKa = 10.48KK53 pKa = 7.95MTEE56 pKa = 3.75SPEE59 pKa = 4.15RR60 pKa = 11.84MASTASPILDD70 pKa = 3.08IFFISRR76 pKa = 11.84PGSRR80 pKa = 11.84LWIVISTTFDD90 pKa = 3.15NFTCASSGCPGKK102 pKa = 9.48STIRR106 pKa = 11.84GLRR109 pKa = 11.84INWSSRR115 pKa = 11.84FLSTSPSTATTIQGIRR131 pKa = 11.84SFPWRR136 pKa = 11.84EE137 pKa = 3.36NSRR140 pKa = 11.84NTTSLLLDD148 pKa = 4.4KK149 pKa = 10.86ISFTFFPDD157 pKa = 2.66KK158 pKa = 11.28GFFKK162 pKa = 10.75SSSNEE167 pKa = 3.59YY168 pKa = 10.34EE169 pKa = 3.65GDD171 pKa = 3.32FRR173 pKa = 11.84IFRR176 pKa = 11.84SPFGRR181 pKa = 11.84MVSSLIIFIQLGIVVSSDD199 pKa = 2.56LAYY202 pKa = 10.18FVRR205 pKa = 11.84QRR207 pKa = 11.84VDD209 pKa = 3.01YY210 pKa = 10.88SPVLGSLLYY219 pKa = 10.22SAKK222 pKa = 10.27QNPLPPHH229 pKa = 5.42FSIRR233 pKa = 11.84IRR235 pKa = 3.53
Molecular weight: 26.25 kDa
Isoelectric point according different methods:
Peptides (in silico digests for buttom-up proteomics)
Below you can find in silico digests of the whole proteome with Trypsin, Chymotrypsin, Trypsin+LysC, LysN, ArgC proteases suitable for different mass spec machines.| Try ESI |
 |
|---|
| ChTry ESI |
 |
|---|
| ArgC ESI |
 |
|---|
| LysN ESI |
 |
|---|
| TryLysC ESI |
 |
|---|
| Try MALDI |
 |
|---|
| ChTry MALDI |
 |
|---|
| ArgC MALDI |
 |
|---|
| LysN MALDI |
 |
|---|
| TryLysC MALDI |
 |
|---|
| Try LTQ |
 |
|---|
| ChTry LTQ |
 |
|---|
| ArgC LTQ |
 |
|---|
| LysN LTQ |
 |
|---|
| TryLysC LTQ |
 |
|---|
| Try MSlow |
 |
|---|
| ChTry MSlow |
 |
|---|
| ArgC MSlow |
 |
|---|
| LysN MSlow |
 |
|---|
| TryLysC MSlow |
 |
|---|
| Try MShigh |
 |
|---|
| ChTry MShigh |
 |
|---|
| ArgC MShigh |
 |
|---|
| LysN MShigh |
 |
|---|
| TryLysC MShigh |
 |
|---|
General Statistics
Number of major isoforms |
Number of additional isoforms |
Number of all proteins |
Number of amino acids |
Min. Seq. Length |
Max. Seq. Length |
Avg. Seq. Length |
Avg. Mol. Weight |
|---|---|---|---|---|---|---|---|
0 |
1418861 |
37 |
2965 |
258.0 |
28.73 |
Amino acid frequency
Ala |
Cys |
Asp |
Glu |
Phe |
Gly |
His |
Ile |
Lys |
Leu |
|---|---|---|---|---|---|---|---|---|---|
7.52 ± 0.039 | 1.124 ± 0.015 |
4.844 ± 0.025 | 6.82 ± 0.04 |
4.051 ± 0.027 | 7.462 ± 0.037 |
1.862 ± 0.018 | 7.47 ± 0.032 |
6.148 ± 0.033 | 10.431 ± 0.043 |
Met |
Asn |
Gln |
Pro |
Arg |
Ser |
Thr |
Val |
Trp |
Tyr |
|---|---|---|---|---|---|---|---|---|---|
2.738 ± 0.02 | 4.109 ± 0.022 |
3.922 ± 0.024 | 3.827 ± 0.024 |
4.703 ± 0.032 | 6.083 ± 0.031 |
5.364 ± 0.03 | 7.21 ± 0.027 |
1.092 ± 0.014 | 3.222 ± 0.022 |
Most of the basic statistics you can see at this page can be downloaded from this CSV file
Proteome-pI is available under Creative Commons Attribution-NoDerivs license, for more details see here
| Reference: Kozlowski LP. Proteome-pI 2.0: Proteome Isoelectric Point Database Update. Nucleic Acids Res. 2021, doi: 10.1093/nar/gkab944 | Contact: Lukasz P. Kozlowski |
