Lutispora thermophila DSM 19022
Taxonomy: cellular organisms; Bacteria; Terrabacteria group; Firmicutes; Clostridia; Eubacteriales; Clostridiaceae; Lutispora; Lutispora thermophila
Average proteome isoelectric point is 6.36
Get precalculated fractions of proteins

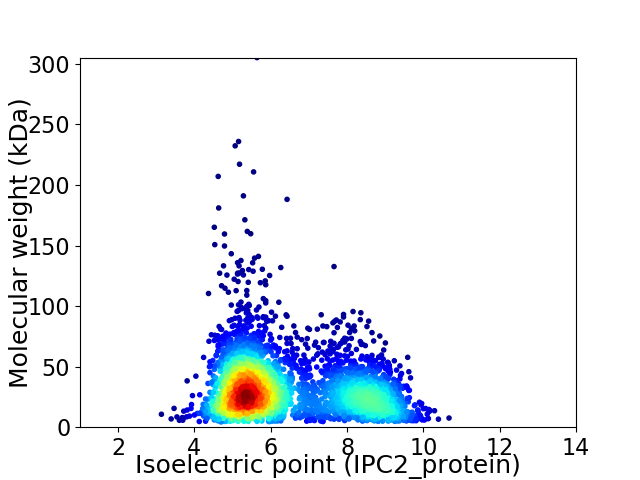
Virtual 2D-PAGE plot for 3409 proteins (isoelectric point calculated using IPC2_protein)
Get csv file with sequences according to given criteria:
* You can choose from 21 different methods for calculating isoelectric point
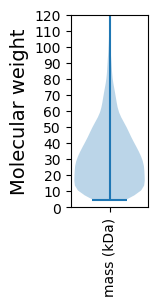
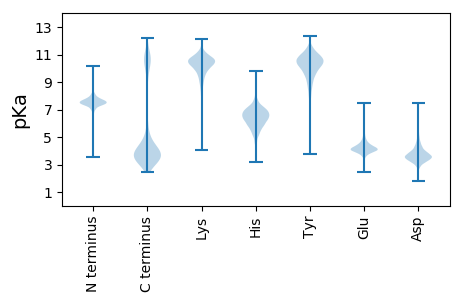
Summary statistics related to proteome-wise predictions


Protein with the lowest isoelectric point:
>tr|A0A1M6H2B0|A0A1M6H2B0_9CLOT Uncharacterized protein OS=Lutispora thermophila DSM 19022 OX=1122184 GN=SAMN02745176_02615 PE=4 SV=1
MM1 pKa = 7.3QIIEE5 pKa = 4.15GLYY8 pKa = 9.21YY9 pKa = 10.87SKK11 pKa = 10.93DD12 pKa = 3.67HH13 pKa = 6.38EE14 pKa = 4.54WVKK17 pKa = 11.07VEE19 pKa = 3.84GDD21 pKa = 3.19KK22 pKa = 11.17AYY24 pKa = 11.24VGISDD29 pKa = 4.61FAQDD33 pKa = 3.56ALGDD37 pKa = 3.75IVFVEE42 pKa = 4.55LPEE45 pKa = 5.67IGTNLIQGEE54 pKa = 4.28ALGSIEE60 pKa = 4.3SVKK63 pKa = 10.58AASDD67 pKa = 3.93VYY69 pKa = 10.92CPVSGKK75 pKa = 9.78VIKK78 pKa = 10.87VNEE81 pKa = 4.15ILVDD85 pKa = 4.69DD86 pKa = 4.58PALLNEE92 pKa = 4.68DD93 pKa = 4.6PYY95 pKa = 10.05EE96 pKa = 3.8NWMICVEE103 pKa = 4.2LTEE106 pKa = 5.46KK107 pKa = 10.96DD108 pKa = 3.87QLDD111 pKa = 3.57QLMNSAEE118 pKa = 4.19YY119 pKa = 10.81EE120 pKa = 4.14DD121 pKa = 4.41FCNEE125 pKa = 3.74EE126 pKa = 3.95AA127 pKa = 4.93
MM1 pKa = 7.3QIIEE5 pKa = 4.15GLYY8 pKa = 9.21YY9 pKa = 10.87SKK11 pKa = 10.93DD12 pKa = 3.67HH13 pKa = 6.38EE14 pKa = 4.54WVKK17 pKa = 11.07VEE19 pKa = 3.84GDD21 pKa = 3.19KK22 pKa = 11.17AYY24 pKa = 11.24VGISDD29 pKa = 4.61FAQDD33 pKa = 3.56ALGDD37 pKa = 3.75IVFVEE42 pKa = 4.55LPEE45 pKa = 5.67IGTNLIQGEE54 pKa = 4.28ALGSIEE60 pKa = 4.3SVKK63 pKa = 10.58AASDD67 pKa = 3.93VYY69 pKa = 10.92CPVSGKK75 pKa = 9.78VIKK78 pKa = 10.87VNEE81 pKa = 4.15ILVDD85 pKa = 4.69DD86 pKa = 4.58PALLNEE92 pKa = 4.68DD93 pKa = 4.6PYY95 pKa = 10.05EE96 pKa = 3.8NWMICVEE103 pKa = 4.2LTEE106 pKa = 5.46KK107 pKa = 10.96DD108 pKa = 3.87QLDD111 pKa = 3.57QLMNSAEE118 pKa = 4.19YY119 pKa = 10.81EE120 pKa = 4.14DD121 pKa = 4.41FCNEE125 pKa = 3.74EE126 pKa = 3.95AA127 pKa = 4.93
Molecular weight: 14.18 kDa
Isoelectric point according different methods:
Protein with the highest isoelectric point:
>tr|A0A1M6EVL7|A0A1M6EVL7_9CLOT L-fuculose-phosphate aldolase OS=Lutispora thermophila DSM 19022 OX=1122184 GN=SAMN02745176_01724 PE=4 SV=1
MM1 pKa = 7.79LILTVTCFFRR11 pKa = 11.84IQRR14 pKa = 11.84PPTWKK19 pKa = 8.49TRR21 pKa = 11.84PFEE24 pKa = 3.91VLARR28 pKa = 11.84MVILRR33 pKa = 11.84FLAPNWCVDD42 pKa = 3.22AYY44 pKa = 10.23ILFVPTANPEE54 pKa = 3.96ASDD57 pKa = 3.62FDD59 pKa = 4.42LMEE62 pKa = 4.49FLSPAVSTSVTPPSCTALMDD82 pKa = 4.18CFHH85 pKa = 7.38FFPSGPFSVRR95 pKa = 11.84NRR97 pKa = 11.84STVDD101 pKa = 2.76SRR103 pKa = 11.84TASAIAALMPFLSMSASCRR122 pKa = 11.84SLFISLLVSPSSLMLYY138 pKa = 9.81IYY140 pKa = 10.37IPFRR144 pKa = 11.84LSRR147 pKa = 11.84EE148 pKa = 3.7KK149 pKa = 10.73RR150 pKa = 11.84RR151 pKa = 11.84GLDD154 pKa = 3.15ATEE157 pKa = 4.28KK158 pKa = 9.33PVRR161 pKa = 11.84AAVVVSTAPISTFPSASNSKK181 pKa = 10.01NRR183 pKa = 11.84IAALYY188 pKa = 9.81RR189 pKa = 11.84FRR191 pKa = 6.04
MM1 pKa = 7.79LILTVTCFFRR11 pKa = 11.84IQRR14 pKa = 11.84PPTWKK19 pKa = 8.49TRR21 pKa = 11.84PFEE24 pKa = 3.91VLARR28 pKa = 11.84MVILRR33 pKa = 11.84FLAPNWCVDD42 pKa = 3.22AYY44 pKa = 10.23ILFVPTANPEE54 pKa = 3.96ASDD57 pKa = 3.62FDD59 pKa = 4.42LMEE62 pKa = 4.49FLSPAVSTSVTPPSCTALMDD82 pKa = 4.18CFHH85 pKa = 7.38FFPSGPFSVRR95 pKa = 11.84NRR97 pKa = 11.84STVDD101 pKa = 2.76SRR103 pKa = 11.84TASAIAALMPFLSMSASCRR122 pKa = 11.84SLFISLLVSPSSLMLYY138 pKa = 9.81IYY140 pKa = 10.37IPFRR144 pKa = 11.84LSRR147 pKa = 11.84EE148 pKa = 3.7KK149 pKa = 10.73RR150 pKa = 11.84RR151 pKa = 11.84GLDD154 pKa = 3.15ATEE157 pKa = 4.28KK158 pKa = 9.33PVRR161 pKa = 11.84AAVVVSTAPISTFPSASNSKK181 pKa = 10.01NRR183 pKa = 11.84IAALYY188 pKa = 9.81RR189 pKa = 11.84FRR191 pKa = 6.04
Molecular weight: 21.36 kDa
Isoelectric point according different methods:
Peptides (in silico digests for buttom-up proteomics)
Below you can find in silico digests of the whole proteome with Trypsin, Chymotrypsin, Trypsin+LysC, LysN, ArgC proteases suitable for different mass spec machines.| Try ESI |
 |
|---|
| ChTry ESI |
 |
|---|
| ArgC ESI |
 |
|---|
| LysN ESI |
 |
|---|
| TryLysC ESI |
 |
|---|
| Try MALDI |
 |
|---|
| ChTry MALDI |
 |
|---|
| ArgC MALDI |
 |
|---|
| LysN MALDI |
 |
|---|
| TryLysC MALDI |
 |
|---|
| Try LTQ |
 |
|---|
| ChTry LTQ |
 |
|---|
| ArgC LTQ |
 |
|---|
| LysN LTQ |
 |
|---|
| TryLysC LTQ |
 |
|---|
| Try MSlow |
 |
|---|
| ChTry MSlow |
 |
|---|
| ArgC MSlow |
 |
|---|
| LysN MSlow |
 |
|---|
| TryLysC MSlow |
 |
|---|
| Try MShigh |
 |
|---|
| ChTry MShigh |
 |
|---|
| ArgC MShigh |
 |
|---|
| LysN MShigh |
 |
|---|
| TryLysC MShigh |
 |
|---|
General Statistics
Number of major isoforms |
Number of additional isoforms |
Number of all proteins |
Number of amino acids |
Min. Seq. Length |
Max. Seq. Length |
Avg. Seq. Length |
Avg. Mol. Weight |
|---|---|---|---|---|---|---|---|
0 |
1016382 |
39 |
2664 |
298.1 |
33.63 |
Amino acid frequency
Ala |
Cys |
Asp |
Glu |
Phe |
Gly |
His |
Ile |
Lys |
Leu |
|---|---|---|---|---|---|---|---|---|---|
6.373 ± 0.05 | 1.14 ± 0.018 |
5.736 ± 0.031 | 7.465 ± 0.042 |
4.113 ± 0.029 | 6.567 ± 0.042 |
1.491 ± 0.017 | 9.654 ± 0.049 |
8.236 ± 0.041 | 8.991 ± 0.045 |
Met |
Asn |
Gln |
Pro |
Arg |
Ser |
Thr |
Val |
Trp |
Tyr |
|---|---|---|---|---|---|---|---|---|---|
2.941 ± 0.022 | 5.385 ± 0.04 |
3.101 ± 0.025 | 2.58 ± 0.024 |
3.963 ± 0.029 | 6.059 ± 0.033 |
4.73 ± 0.029 | 6.495 ± 0.031 |
0.75 ± 0.013 | 4.23 ± 0.031 |
Most of the basic statistics you can see at this page can be downloaded from this CSV file
Proteome-pI is available under Creative Commons Attribution-NoDerivs license, for more details see here
| Reference: Kozlowski LP. Proteome-pI 2.0: Proteome Isoelectric Point Database Update. Nucleic Acids Res. 2021, doi: 10.1093/nar/gkab944 | Contact: Lukasz P. Kozlowski |
