Carnation etched ring virus (CERV)
Taxonomy: Viruses; Riboviria; Pararnavirae; Artverviricota; Revtraviricetes; Ortervirales; Caulimoviridae; Caulimovirus
Average proteome isoelectric point is 7.02
Get precalculated fractions of proteins

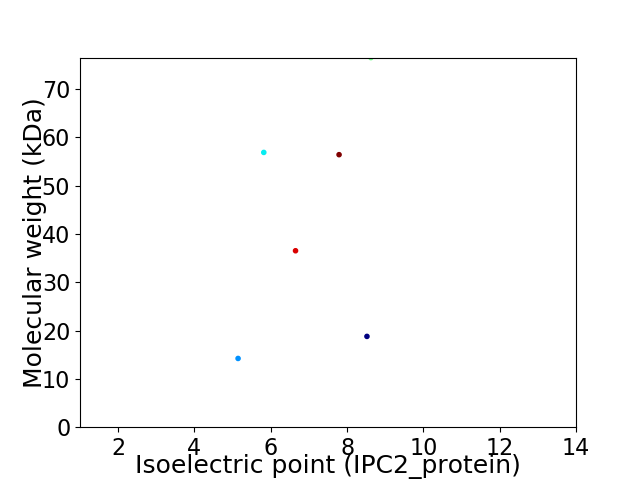
Virtual 2D-PAGE plot for 6 proteins (isoelectric point calculated using IPC2_protein)
Get csv file with sequences according to given criteria:
* You can choose from 21 different methods for calculating isoelectric point
Summary statistics related to proteome-wise predictions


Protein with the lowest isoelectric point:
>sp|P05399|CAPSD_CERV Probable capsid protein OS=Carnation etched ring virus OX=10640 GN=ORF IV PE=3 SV=1
MM1 pKa = 7.37NLATIASEE9 pKa = 4.07IEE11 pKa = 4.3VVKK14 pKa = 10.08TNQKK18 pKa = 9.26TIEE21 pKa = 4.19SKK23 pKa = 10.25IDD25 pKa = 3.33QILAKK30 pKa = 10.16IGSTPDD36 pKa = 2.97EE37 pKa = 4.49SSNLEE42 pKa = 3.89SVAAKK47 pKa = 10.14IISDD51 pKa = 3.52LTKK54 pKa = 10.64EE55 pKa = 4.13MKK57 pKa = 9.81EE58 pKa = 3.94CHH60 pKa = 6.23CNKK63 pKa = 10.26EE64 pKa = 3.84IVEE67 pKa = 4.29ILNKK71 pKa = 10.27DD72 pKa = 3.3KK73 pKa = 11.27AIIPSPEE80 pKa = 3.44QDD82 pKa = 3.62SIQKK86 pKa = 10.22RR87 pKa = 11.84LSEE90 pKa = 3.98PQYY93 pKa = 9.58TFPNFDD99 pKa = 3.32VGNEE103 pKa = 3.97GMGSSTNPNALKK115 pKa = 10.03WPPTEE120 pKa = 5.67KK121 pKa = 10.11PQPWPPRR128 pKa = 3.54
MM1 pKa = 7.37NLATIASEE9 pKa = 4.07IEE11 pKa = 4.3VVKK14 pKa = 10.08TNQKK18 pKa = 9.26TIEE21 pKa = 4.19SKK23 pKa = 10.25IDD25 pKa = 3.33QILAKK30 pKa = 10.16IGSTPDD36 pKa = 2.97EE37 pKa = 4.49SSNLEE42 pKa = 3.89SVAAKK47 pKa = 10.14IISDD51 pKa = 3.52LTKK54 pKa = 10.64EE55 pKa = 4.13MKK57 pKa = 9.81EE58 pKa = 3.94CHH60 pKa = 6.23CNKK63 pKa = 10.26EE64 pKa = 3.84IVEE67 pKa = 4.29ILNKK71 pKa = 10.27DD72 pKa = 3.3KK73 pKa = 11.27AIIPSPEE80 pKa = 3.44QDD82 pKa = 3.62SIQKK86 pKa = 10.22RR87 pKa = 11.84LSEE90 pKa = 3.98PQYY93 pKa = 9.58TFPNFDD99 pKa = 3.32VGNEE103 pKa = 3.97GMGSSTNPNALKK115 pKa = 10.03WPPTEE120 pKa = 5.67KK121 pKa = 10.11PQPWPPRR128 pKa = 3.54
Molecular weight: 14.23 kDa
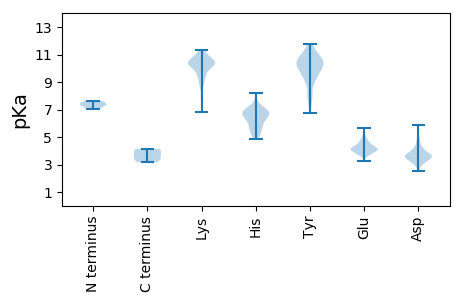
Isoelectric point according different methods:
Protein with the highest isoelectric point:
>sp|P05398|VAP_CERV Virion-associated protein OS=Carnation etched ring virus OX=10640 GN=ORF III PE=3 SV=1
MM1 pKa = 7.54SLTTYY6 pKa = 8.85PHH8 pKa = 7.01IYY10 pKa = 10.05KK11 pKa = 10.16KK12 pKa = 10.15EE13 pKa = 3.89QILKK17 pKa = 10.42LKK19 pKa = 10.43RR20 pKa = 11.84LNKK23 pKa = 10.09LSNDD27 pKa = 2.92RR28 pKa = 11.84KK29 pKa = 10.44FFFSSVKK36 pKa = 9.17GTLPGIISHH45 pKa = 6.74CNNINEE51 pKa = 4.29ILGRR55 pKa = 11.84CYY57 pKa = 10.7LGICKK62 pKa = 10.2LNSFFGLSKK71 pKa = 10.97DD72 pKa = 3.69PSDD75 pKa = 3.72KK76 pKa = 11.1LSVSKK81 pKa = 11.0SPSVYY86 pKa = 9.78TLPSKK91 pKa = 10.4IFKK94 pKa = 10.33EE95 pKa = 4.46GGGNGDD101 pKa = 3.38NTTTQTDD108 pKa = 3.48ILKK111 pKa = 10.04NAQDD115 pKa = 3.64QVILSKK121 pKa = 10.88KK122 pKa = 9.36IDD124 pKa = 3.65EE125 pKa = 4.88LQTQVKK131 pKa = 8.76EE132 pKa = 4.11LSSKK136 pKa = 10.41IEE138 pKa = 3.98PEE140 pKa = 4.03PLTKK144 pKa = 10.39EE145 pKa = 4.45DD146 pKa = 3.05IKK148 pKa = 10.74KK149 pKa = 9.04TYY151 pKa = 7.29EE152 pKa = 3.76TLSRR156 pKa = 11.84IEE158 pKa = 4.48SGLKK162 pKa = 10.31GIIGIEE168 pKa = 3.85
MM1 pKa = 7.54SLTTYY6 pKa = 8.85PHH8 pKa = 7.01IYY10 pKa = 10.05KK11 pKa = 10.16KK12 pKa = 10.15EE13 pKa = 3.89QILKK17 pKa = 10.42LKK19 pKa = 10.43RR20 pKa = 11.84LNKK23 pKa = 10.09LSNDD27 pKa = 2.92RR28 pKa = 11.84KK29 pKa = 10.44FFFSSVKK36 pKa = 9.17GTLPGIISHH45 pKa = 6.74CNNINEE51 pKa = 4.29ILGRR55 pKa = 11.84CYY57 pKa = 10.7LGICKK62 pKa = 10.2LNSFFGLSKK71 pKa = 10.97DD72 pKa = 3.69PSDD75 pKa = 3.72KK76 pKa = 11.1LSVSKK81 pKa = 11.0SPSVYY86 pKa = 9.78TLPSKK91 pKa = 10.4IFKK94 pKa = 10.33EE95 pKa = 4.46GGGNGDD101 pKa = 3.38NTTTQTDD108 pKa = 3.48ILKK111 pKa = 10.04NAQDD115 pKa = 3.64QVILSKK121 pKa = 10.88KK122 pKa = 9.36IDD124 pKa = 3.65EE125 pKa = 4.88LQTQVKK131 pKa = 8.76EE132 pKa = 4.11LSSKK136 pKa = 10.41IEE138 pKa = 3.98PEE140 pKa = 4.03PLTKK144 pKa = 10.39EE145 pKa = 4.45DD146 pKa = 3.05IKK148 pKa = 10.74KK149 pKa = 9.04TYY151 pKa = 7.29EE152 pKa = 3.76TLSRR156 pKa = 11.84IEE158 pKa = 4.48SGLKK162 pKa = 10.31GIIGIEE168 pKa = 3.85
Molecular weight: 18.8 kDa
Isoelectric point according different methods:
Peptides (in silico digests for buttom-up proteomics)
Below you can find in silico digests of the whole proteome with Trypsin, Chymotrypsin, Trypsin+LysC, LysN, ArgC proteases suitable for different mass spec machines.| Try ESI |
 |
|---|
| ChTry ESI |
 |
|---|
| ArgC ESI |
 |
|---|
| LysN ESI |
 |
|---|
| TryLysC ESI |
 |
|---|
| Try MALDI |
 |
|---|
| ChTry MALDI |
 |
|---|
| ArgC MALDI |
 |
|---|
| LysN MALDI |
 |
|---|
| TryLysC MALDI |
 |
|---|
| Try LTQ |
 |
|---|
| ChTry LTQ |
 |
|---|
| ArgC LTQ |
 |
|---|
| LysN LTQ |
 |
|---|
| TryLysC LTQ |
 |
|---|
| Try MSlow |
 |
|---|
| ChTry MSlow |
 |
|---|
| ArgC MSlow |
 |
|---|
| LysN MSlow |
 |
|---|
| TryLysC MSlow |
 |
|---|
| Try MShigh |
 |
|---|
| ChTry MShigh |
 |
|---|
| ArgC MShigh |
 |
|---|
| LysN MShigh |
 |
|---|
| TryLysC MShigh |
 |
|---|
General Statistics
Number of major isoforms |
Number of additional isoforms |
Number of all proteins |
Number of amino acids |
Min. Seq. Length |
Max. Seq. Length |
Avg. Seq. Length |
Avg. Mol. Weight |
|---|---|---|---|---|---|---|---|
0 |
2264 |
128 |
659 |
377.3 |
43.23 |
Amino acid frequency
Ala |
Cys |
Asp |
Glu |
Phe |
Gly |
His |
Ile |
Lys |
Leu |
|---|---|---|---|---|---|---|---|---|---|
4.196 ± 0.362 | 1.723 ± 0.364 |
4.947 ± 0.472 | 8.348 ± 0.883 |
4.417 ± 0.451 | 4.373 ± 0.345 |
1.943 ± 0.467 | 7.818 ± 0.538 |
11.042 ± 0.325 | 8.701 ± 0.574 |
Met |
Asn |
Gln |
Pro |
Arg |
Ser |
Thr |
Val |
Trp |
Tyr |
|---|---|---|---|---|---|---|---|---|---|
1.502 ± 0.137 | 5.919 ± 0.444 |
4.859 ± 0.459 | 3.931 ± 0.252 |
3.534 ± 0.306 | 9.231 ± 0.687 |
4.549 ± 0.469 | 4.196 ± 0.269 |
0.883 ± 0.189 | 3.887 ± 0.375 |
Most of the basic statistics you can see at this page can be downloaded from this CSV file
Proteome-pI is available under Creative Commons Attribution-NoDerivs license, for more details see here
| Reference: Kozlowski LP. Proteome-pI 2.0: Proteome Isoelectric Point Database Update. Nucleic Acids Res. 2021, doi: 10.1093/nar/gkab944 | Contact: Lukasz P. Kozlowski |
