Cavia porcellus (Guinea pig)
Taxonomy: cellular organisms; Eukaryota; Opisthokonta; Metazoa; Eumetazoa; Bilateria; Deuterostomia; Chordata; Craniata; Vertebrata; Gnathostomata; Teleostomi; Euteleostomi; Sarcopterygii; Dipnotetrapodomorpha; Tetrapoda; Amniota; Mammalia; Theria; Eutheria; Boreoeutheria;
Average proteome isoelectric point is 6.69
Get precalculated fractions of proteins

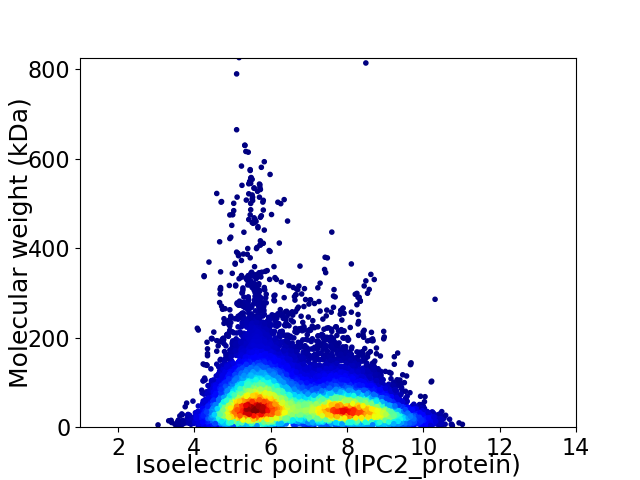
Virtual 2D-PAGE plot for 25080 proteins (isoelectric point calculated using IPC2_protein)
Get csv file with sequences according to given criteria:
* You can choose from 21 different methods for calculating isoelectric point
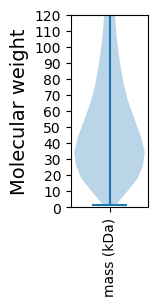
Summary statistics related to proteome-wise predictions


Protein with the lowest isoelectric point:
>tr|H0W6Z4|H0W6Z4_CAVPO Vesicle-fusing ATPase OS=Cavia porcellus OX=10141 PE=3 SV=2
MM1 pKa = 7.66EE2 pKa = 5.17EE3 pKa = 4.0NSVVLSEE10 pKa = 4.16PLGLLLLPLIAMLLMVLCVRR30 pKa = 11.84CRR32 pKa = 11.84EE33 pKa = 4.06LRR35 pKa = 11.84GSYY38 pKa = 10.62GSASEE43 pKa = 4.42NRR45 pKa = 11.84SQTEE49 pKa = 3.86SFLFKK54 pKa = 8.96PTQMLPSWSPYY65 pKa = 9.37PSAPDD70 pKa = 3.43PHH72 pKa = 8.07LSQPDD77 pKa = 3.84LLHH80 pKa = 6.79IPRR83 pKa = 11.84SPQLLLGSHH92 pKa = 6.8RR93 pKa = 11.84MPSSQQDD100 pKa = 3.01SDD102 pKa = 3.88GANSVASYY110 pKa = 10.49EE111 pKa = 4.22NQEE114 pKa = 4.42VACEE118 pKa = 4.0DD119 pKa = 3.58ADD121 pKa = 4.09KK122 pKa = 11.7DD123 pKa = 3.96EE124 pKa = 6.09DD125 pKa = 3.96EE126 pKa = 4.47EE127 pKa = 5.18DD128 pKa = 4.13YY129 pKa = 11.41PNEE132 pKa = 4.37GYY134 pKa = 10.63GGYY137 pKa = 9.87VEE139 pKa = 5.11VLPDD143 pKa = 3.62STPATSTGVPSAPVPSNPGLRR164 pKa = 11.84DD165 pKa = 3.14SAFSMEE171 pKa = 3.88SRR173 pKa = 11.84DD174 pKa = 3.72YY175 pKa = 11.42VNVPEE180 pKa = 4.5SEE182 pKa = 4.35EE183 pKa = 4.03SAEE186 pKa = 3.99ASLDD190 pKa = 3.47GSLEE194 pKa = 4.1YY195 pKa = 11.41VNVSQEE201 pKa = 4.04LQPLPGTEE209 pKa = 4.06PATLSSQEE217 pKa = 4.09VEE219 pKa = 4.22DD220 pKa = 4.94EE221 pKa = 4.27EE222 pKa = 6.16DD223 pKa = 3.93EE224 pKa = 4.4EE225 pKa = 5.78APDD228 pKa = 3.76YY229 pKa = 11.72EE230 pKa = 4.4NVQEE234 pKa = 4.58LSS236 pKa = 3.31
MM1 pKa = 7.66EE2 pKa = 5.17EE3 pKa = 4.0NSVVLSEE10 pKa = 4.16PLGLLLLPLIAMLLMVLCVRR30 pKa = 11.84CRR32 pKa = 11.84EE33 pKa = 4.06LRR35 pKa = 11.84GSYY38 pKa = 10.62GSASEE43 pKa = 4.42NRR45 pKa = 11.84SQTEE49 pKa = 3.86SFLFKK54 pKa = 8.96PTQMLPSWSPYY65 pKa = 9.37PSAPDD70 pKa = 3.43PHH72 pKa = 8.07LSQPDD77 pKa = 3.84LLHH80 pKa = 6.79IPRR83 pKa = 11.84SPQLLLGSHH92 pKa = 6.8RR93 pKa = 11.84MPSSQQDD100 pKa = 3.01SDD102 pKa = 3.88GANSVASYY110 pKa = 10.49EE111 pKa = 4.22NQEE114 pKa = 4.42VACEE118 pKa = 4.0DD119 pKa = 3.58ADD121 pKa = 4.09KK122 pKa = 11.7DD123 pKa = 3.96EE124 pKa = 6.09DD125 pKa = 3.96EE126 pKa = 4.47EE127 pKa = 5.18DD128 pKa = 4.13YY129 pKa = 11.41PNEE132 pKa = 4.37GYY134 pKa = 10.63GGYY137 pKa = 9.87VEE139 pKa = 5.11VLPDD143 pKa = 3.62STPATSTGVPSAPVPSNPGLRR164 pKa = 11.84DD165 pKa = 3.14SAFSMEE171 pKa = 3.88SRR173 pKa = 11.84DD174 pKa = 3.72YY175 pKa = 11.42VNVPEE180 pKa = 4.5SEE182 pKa = 4.35EE183 pKa = 4.03SAEE186 pKa = 3.99ASLDD190 pKa = 3.47GSLEE194 pKa = 4.1YY195 pKa = 11.41VNVSQEE201 pKa = 4.04LQPLPGTEE209 pKa = 4.06PATLSSQEE217 pKa = 4.09VEE219 pKa = 4.22DD220 pKa = 4.94EE221 pKa = 4.27EE222 pKa = 6.16DD223 pKa = 3.93EE224 pKa = 4.4EE225 pKa = 5.78APDD228 pKa = 3.76YY229 pKa = 11.72EE230 pKa = 4.4NVQEE234 pKa = 4.58LSS236 pKa = 3.31
Molecular weight: 25.74 kDa
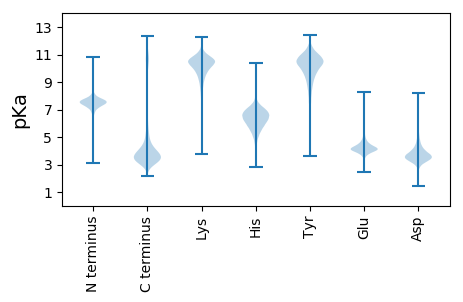
Isoelectric point according different methods:
Protein with the highest isoelectric point:
>tr|A0A286XJT6|A0A286XJT6_CAVPO Chromosome 5 open reading frame 24 OS=Cavia porcellus OX=10141 GN=C5orf24 PE=3 SV=1
MM1 pKa = 7.1RR2 pKa = 11.84AKK4 pKa = 9.12WRR6 pKa = 11.84KK7 pKa = 9.1KK8 pKa = 9.32RR9 pKa = 11.84MRR11 pKa = 11.84RR12 pKa = 11.84LKK14 pKa = 10.08RR15 pKa = 11.84KK16 pKa = 8.21RR17 pKa = 11.84RR18 pKa = 11.84KK19 pKa = 8.46MRR21 pKa = 11.84QRR23 pKa = 11.84SKK25 pKa = 11.41
MM1 pKa = 7.1RR2 pKa = 11.84AKK4 pKa = 9.12WRR6 pKa = 11.84KK7 pKa = 9.1KK8 pKa = 9.32RR9 pKa = 11.84MRR11 pKa = 11.84RR12 pKa = 11.84LKK14 pKa = 10.08RR15 pKa = 11.84KK16 pKa = 8.21RR17 pKa = 11.84RR18 pKa = 11.84KK19 pKa = 8.46MRR21 pKa = 11.84QRR23 pKa = 11.84SKK25 pKa = 11.41
Molecular weight: 3.46 kDa
Isoelectric point according different methods:
Peptides (in silico digests for buttom-up proteomics)
Below you can find in silico digests of the whole proteome with Trypsin, Chymotrypsin, Trypsin+LysC, LysN, ArgC proteases suitable for different mass spec machines.| Try ESI |
 |
|---|
| ChTry ESI |
 |
|---|
| ArgC ESI |
 |
|---|
| LysN ESI |
 |
|---|
| TryLysC ESI |
 |
|---|
| Try MALDI |
 |
|---|
| ChTry MALDI |
 |
|---|
| ArgC MALDI |
 |
|---|
| LysN MALDI |
 |
|---|
| TryLysC MALDI |
 |
|---|
| Try LTQ |
 |
|---|
| ChTry LTQ |
 |
|---|
| ArgC LTQ |
 |
|---|
| LysN LTQ |
 |
|---|
| TryLysC LTQ |
 |
|---|
| Try MSlow |
 |
|---|
| ChTry MSlow |
 |
|---|
| ArgC MSlow |
 |
|---|
| LysN MSlow |
 |
|---|
| TryLysC MSlow |
 |
|---|
| Try MShigh |
 |
|---|
| ChTry MShigh |
 |
|---|
| ArgC MShigh |
 |
|---|
| LysN MShigh |
 |
|---|
| TryLysC MShigh |
 |
|---|
General Statistics
Number of major isoforms |
Number of additional isoforms |
Number of all proteins |
Number of amino acids |
Min. Seq. Length |
Max. Seq. Length |
Avg. Seq. Length |
Avg. Mol. Weight |
|---|---|---|---|---|---|---|---|
14117386 |
9 |
7286 |
562.9 |
62.77 |
Amino acid frequency
Ala |
Cys |
Asp |
Glu |
Phe |
Gly |
His |
Ile |
Lys |
Leu |
|---|---|---|---|---|---|---|---|---|---|
7.013 ± 0.015 | 2.241 ± 0.014 |
4.856 ± 0.011 | 7.033 ± 0.02 |
3.71 ± 0.011 | 6.409 ± 0.02 |
2.588 ± 0.007 | 4.408 ± 0.013 |
5.684 ± 0.018 | 10.078 ± 0.021 |
Met |
Asn |
Gln |
Pro |
Arg |
Ser |
Thr |
Val |
Trp |
Tyr |
|---|---|---|---|---|---|---|---|---|---|
2.183 ± 0.006 | 3.579 ± 0.008 |
6.14 ± 0.02 | 4.8 ± 0.014 |
5.634 ± 0.014 | 8.285 ± 0.021 |
5.306 ± 0.009 | 6.137 ± 0.011 |
1.192 ± 0.006 | 2.71 ± 0.01 |
Most of the basic statistics you can see at this page can be downloaded from this CSV file
Proteome-pI is available under Creative Commons Attribution-NoDerivs license, for more details see here
| Reference: Kozlowski LP. Proteome-pI 2.0: Proteome Isoelectric Point Database Update. Nucleic Acids Res. 2021, doi: 10.1093/nar/gkab944 | Contact: Lukasz P. Kozlowski |
