Roseivivax halodurans JCM 10272
Taxonomy: cellular organisms; Bacteria; Proteobacteria; Alphaproteobacteria; Rhodobacterales; Roseobacteraceae; Roseivivax; Roseivivax halodurans
Average proteome isoelectric point is 6.11
Get precalculated fractions of proteins

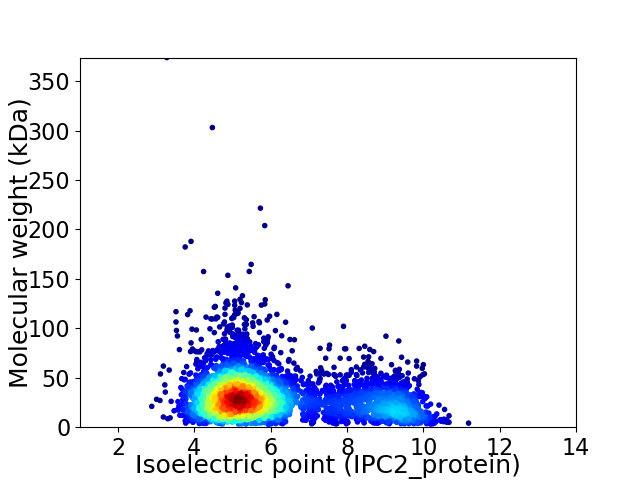
Virtual 2D-PAGE plot for 4304 proteins (isoelectric point calculated using IPC2_protein)
Get csv file with sequences according to given criteria:
* You can choose from 21 different methods for calculating isoelectric point
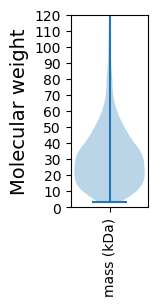
Summary statistics related to proteome-wise predictions


Protein with the lowest isoelectric point:
>tr|X7EL04|X7EL04_9RHOB LacI family transcription regulator OS=Roseivivax halodurans JCM 10272 OX=1449350 GN=OCH239_01700 PE=4 SV=1
MM1 pKa = 6.88FTRR4 pKa = 11.84AISTSVAALLLAGAAHH20 pKa = 6.56AQDD23 pKa = 3.21QSIIVQSTTSTANSGLYY40 pKa = 10.14DD41 pKa = 3.46HH42 pKa = 7.7LIPIFEE48 pKa = 4.47EE49 pKa = 4.18EE50 pKa = 3.89SGITVNVVAVGTGQAITNAEE70 pKa = 4.05NCDD73 pKa = 3.23GDD75 pKa = 4.51LLLVHH80 pKa = 7.15AKK82 pKa = 9.34PAEE85 pKa = 4.02EE86 pKa = 4.26AFVEE90 pKa = 4.2AGYY93 pKa = 8.52GTEE96 pKa = 4.46RR97 pKa = 11.84TDD99 pKa = 4.25LMYY102 pKa = 11.02NDD104 pKa = 4.27FVIVGPAEE112 pKa = 4.38DD113 pKa = 3.78PAGVDD118 pKa = 3.91GMEE121 pKa = 4.71DD122 pKa = 3.36AQDD125 pKa = 3.84ALSQIAGSGATFASRR140 pKa = 11.84GDD142 pKa = 3.9DD143 pKa = 3.29SGTHH147 pKa = 4.88QKK149 pKa = 10.24EE150 pKa = 3.67LSLWEE155 pKa = 4.35GTDD158 pKa = 3.57ADD160 pKa = 4.07PTSGSGEE167 pKa = 4.14WYY169 pKa = 10.28RR170 pKa = 11.84EE171 pKa = 4.0TGSGMGATLNAGIGMGAYY189 pKa = 10.58VMTDD193 pKa = 2.74RR194 pKa = 11.84ATWISFEE201 pKa = 4.09NKK203 pKa = 8.25QDD205 pKa = 3.68YY206 pKa = 10.03EE207 pKa = 4.22ILVEE211 pKa = 4.23GDD213 pKa = 2.96EE214 pKa = 5.6DD215 pKa = 4.77LFNQYY220 pKa = 9.89GVIPVSPDD228 pKa = 2.63HH229 pKa = 6.69CPSVNIEE236 pKa = 3.98AAEE239 pKa = 4.17TFADD243 pKa = 3.41WLLSAEE249 pKa = 4.08GQEE252 pKa = 4.71AIGAYY257 pKa = 8.45EE258 pKa = 4.15VEE260 pKa = 4.39GQQLFFPNAPASS272 pKa = 3.55
MM1 pKa = 6.88FTRR4 pKa = 11.84AISTSVAALLLAGAAHH20 pKa = 6.56AQDD23 pKa = 3.21QSIIVQSTTSTANSGLYY40 pKa = 10.14DD41 pKa = 3.46HH42 pKa = 7.7LIPIFEE48 pKa = 4.47EE49 pKa = 4.18EE50 pKa = 3.89SGITVNVVAVGTGQAITNAEE70 pKa = 4.05NCDD73 pKa = 3.23GDD75 pKa = 4.51LLLVHH80 pKa = 7.15AKK82 pKa = 9.34PAEE85 pKa = 4.02EE86 pKa = 4.26AFVEE90 pKa = 4.2AGYY93 pKa = 8.52GTEE96 pKa = 4.46RR97 pKa = 11.84TDD99 pKa = 4.25LMYY102 pKa = 11.02NDD104 pKa = 4.27FVIVGPAEE112 pKa = 4.38DD113 pKa = 3.78PAGVDD118 pKa = 3.91GMEE121 pKa = 4.71DD122 pKa = 3.36AQDD125 pKa = 3.84ALSQIAGSGATFASRR140 pKa = 11.84GDD142 pKa = 3.9DD143 pKa = 3.29SGTHH147 pKa = 4.88QKK149 pKa = 10.24EE150 pKa = 3.67LSLWEE155 pKa = 4.35GTDD158 pKa = 3.57ADD160 pKa = 4.07PTSGSGEE167 pKa = 4.14WYY169 pKa = 10.28RR170 pKa = 11.84EE171 pKa = 4.0TGSGMGATLNAGIGMGAYY189 pKa = 10.58VMTDD193 pKa = 2.74RR194 pKa = 11.84ATWISFEE201 pKa = 4.09NKK203 pKa = 8.25QDD205 pKa = 3.68YY206 pKa = 10.03EE207 pKa = 4.22ILVEE211 pKa = 4.23GDD213 pKa = 2.96EE214 pKa = 5.6DD215 pKa = 4.77LFNQYY220 pKa = 9.89GVIPVSPDD228 pKa = 2.63HH229 pKa = 6.69CPSVNIEE236 pKa = 3.98AAEE239 pKa = 4.17TFADD243 pKa = 3.41WLLSAEE249 pKa = 4.08GQEE252 pKa = 4.71AIGAYY257 pKa = 8.45EE258 pKa = 4.15VEE260 pKa = 4.39GQQLFFPNAPASS272 pKa = 3.55
Molecular weight: 28.66 kDa
Isoelectric point according different methods:
Protein with the highest isoelectric point:
>tr|X7EAB8|X7EAB8_9RHOB Integrase OS=Roseivivax halodurans JCM 10272 OX=1449350 GN=OCH239_14730 PE=4 SV=1
MM1 pKa = 7.57SRR3 pKa = 11.84TNLIAGVRR11 pKa = 11.84RR12 pKa = 11.84GTGRR16 pKa = 11.84ATGVRR21 pKa = 11.84RR22 pKa = 11.84AGWRR26 pKa = 11.84AGPRR30 pKa = 11.84RR31 pKa = 11.84MPSIGRR37 pKa = 11.84VV38 pKa = 3.14
MM1 pKa = 7.57SRR3 pKa = 11.84TNLIAGVRR11 pKa = 11.84RR12 pKa = 11.84GTGRR16 pKa = 11.84ATGVRR21 pKa = 11.84RR22 pKa = 11.84AGWRR26 pKa = 11.84AGPRR30 pKa = 11.84RR31 pKa = 11.84MPSIGRR37 pKa = 11.84VV38 pKa = 3.14
Molecular weight: 4.13 kDa
Isoelectric point according different methods:
Peptides (in silico digests for buttom-up proteomics)
Below you can find in silico digests of the whole proteome with Trypsin, Chymotrypsin, Trypsin+LysC, LysN, ArgC proteases suitable for different mass spec machines.| Try ESI |
 |
|---|
| ChTry ESI |
 |
|---|
| ArgC ESI |
 |
|---|
| LysN ESI |
 |
|---|
| TryLysC ESI |
 |
|---|
| Try MALDI |
 |
|---|
| ChTry MALDI |
 |
|---|
| ArgC MALDI |
 |
|---|
| LysN MALDI |
 |
|---|
| TryLysC MALDI |
 |
|---|
| Try LTQ |
 |
|---|
| ChTry LTQ |
 |
|---|
| ArgC LTQ |
 |
|---|
| LysN LTQ |
 |
|---|
| TryLysC LTQ |
 |
|---|
| Try MSlow |
 |
|---|
| ChTry MSlow |
 |
|---|
| ArgC MSlow |
 |
|---|
| LysN MSlow |
 |
|---|
| TryLysC MSlow |
 |
|---|
| Try MShigh |
 |
|---|
| ChTry MShigh |
 |
|---|
| ArgC MShigh |
 |
|---|
| LysN MShigh |
 |
|---|
| TryLysC MShigh |
 |
|---|
General Statistics
Number of major isoforms |
Number of additional isoforms |
Number of all proteins |
Number of amino acids |
Min. Seq. Length |
Max. Seq. Length |
Avg. Seq. Length |
Avg. Mol. Weight |
|---|---|---|---|---|---|---|---|
0 |
1296111 |
28 |
3670 |
301.1 |
32.62 |
Amino acid frequency
Ala |
Cys |
Asp |
Glu |
Phe |
Gly |
His |
Ile |
Lys |
Leu |
|---|---|---|---|---|---|---|---|---|---|
12.66 ± 0.054 | 0.865 ± 0.013 |
6.121 ± 0.038 | 6.498 ± 0.04 |
3.567 ± 0.025 | 8.96 ± 0.039 |
2.008 ± 0.019 | 4.906 ± 0.027 |
2.599 ± 0.031 | 10.015 ± 0.049 |
Met |
Asn |
Gln |
Pro |
Arg |
Ser |
Thr |
Val |
Trp |
Tyr |
|---|---|---|---|---|---|---|---|---|---|
2.651 ± 0.019 | 2.234 ± 0.02 |
5.167 ± 0.029 | 2.863 ± 0.018 |
7.399 ± 0.044 | 5.248 ± 0.026 |
5.433 ± 0.023 | 7.293 ± 0.028 |
1.412 ± 0.014 | 2.102 ± 0.017 |
Most of the basic statistics you can see at this page can be downloaded from this CSV file
Proteome-pI is available under Creative Commons Attribution-NoDerivs license, for more details see here
| Reference: Kozlowski LP. Proteome-pI 2.0: Proteome Isoelectric Point Database Update. Nucleic Acids Res. 2021, doi: 10.1093/nar/gkab944 | Contact: Lukasz P. Kozlowski |
