Thalassiosira pseudonana (Marine diatom) (Cyclotella nana)
Taxonomy: cellular organisms; Eukaryota; Sar; Stramenopiles; Ochrophyta; Bacillariophyta; Coscinodiscophyceae; Thalassiosirophycidae; Thalassiosirales; Thalassiosiraceae; Thalassiosira
Average proteome isoelectric point is 6.02
Get precalculated fractions of proteins

Virtual 2D-PAGE plot for 11718 proteins (isoelectric point calculated using IPC2_protein)
Get csv file with sequences according to given criteria:
* You can choose from 21 different methods for calculating isoelectric point
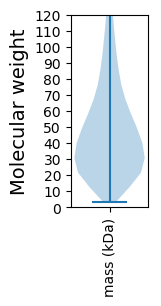
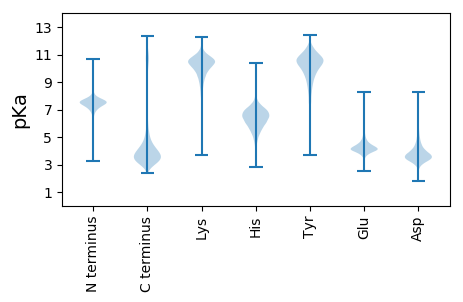
Summary statistics related to proteome-wise predictions


Protein with the lowest isoelectric point:
>tr|B8CAV6|B8CAV6_THAPS Uncharacterized protein OS=Thalassiosira pseudonana OX=35128 GN=THAPSDRAFT_9279 PE=4 SV=1
MM1 pKa = 7.49KK2 pKa = 9.53PLSFTYY8 pKa = 9.92IVTMSPFLFTKK19 pKa = 10.45GASSSSARR27 pKa = 11.84TTVIRR32 pKa = 11.84RR33 pKa = 11.84MRR35 pKa = 11.84TTTTEE40 pKa = 3.69QVYY43 pKa = 10.04KK44 pKa = 10.37SSKK47 pKa = 10.14AADD50 pKa = 3.76SKK52 pKa = 11.5SSSKK56 pKa = 10.69DD57 pKa = 3.0RR58 pKa = 11.84SLLTNEE64 pKa = 4.2EE65 pKa = 4.18GAISFSFSLHH75 pKa = 5.94MPPILPPDD83 pKa = 4.4IISNNPFDD91 pKa = 5.09TIPDD95 pKa = 3.85TTTTTTTDD103 pKa = 3.13NEE105 pKa = 4.93SPFSITNDD113 pKa = 3.4GVPSLIDD120 pKa = 3.41GSMSIMDD127 pKa = 3.66TTEE130 pKa = 3.35ISAEE134 pKa = 4.06SDD136 pKa = 3.21TTPDD140 pKa = 4.05DD141 pKa = 3.69NPFDD145 pKa = 4.03VDD147 pKa = 3.79LSTRR151 pKa = 11.84VPLSTIPTLSPMEE164 pKa = 5.04DD165 pKa = 3.59DD166 pKa = 4.43NNNILTPSPSVDD178 pKa = 3.34PFSGLWDD185 pKa = 3.99LDD187 pKa = 3.49IPGAFSMSMSLSMMSMSVGYY207 pKa = 9.84FDD209 pKa = 5.32HH210 pKa = 7.7SEE212 pKa = 4.06GLPDD216 pKa = 4.92FPFSDD221 pKa = 4.08FSMPMMSMSMDD232 pKa = 5.18DD233 pKa = 4.14IVSMACPSSCTTSFCEE249 pKa = 3.8CTYY252 pKa = 10.01MEE254 pKa = 4.86EE255 pKa = 4.39VEE257 pKa = 4.77ADD259 pKa = 4.52CIPQIVNEE267 pKa = 4.31CSITQPKK274 pKa = 8.59SQCLVDD280 pKa = 5.07LFDD283 pKa = 4.32NGVGEE288 pKa = 4.84SSDD291 pKa = 3.38IFCNSAVCLGEE302 pKa = 4.16GKK304 pKa = 9.96SEE306 pKa = 4.11LEE308 pKa = 3.56CRR310 pKa = 11.84YY311 pKa = 10.3RR312 pKa = 11.84GVCFAMEE319 pKa = 4.64EE320 pKa = 4.04EE321 pKa = 5.04GGWNTIIGLSLSMSFSMSVSLTEE344 pKa = 4.12TTVTTVVPSPSFGGLTMIPTSCYY367 pKa = 10.33TFDD370 pKa = 3.97SDD372 pKa = 4.71
MM1 pKa = 7.49KK2 pKa = 9.53PLSFTYY8 pKa = 9.92IVTMSPFLFTKK19 pKa = 10.45GASSSSARR27 pKa = 11.84TTVIRR32 pKa = 11.84RR33 pKa = 11.84MRR35 pKa = 11.84TTTTEE40 pKa = 3.69QVYY43 pKa = 10.04KK44 pKa = 10.37SSKK47 pKa = 10.14AADD50 pKa = 3.76SKK52 pKa = 11.5SSSKK56 pKa = 10.69DD57 pKa = 3.0RR58 pKa = 11.84SLLTNEE64 pKa = 4.2EE65 pKa = 4.18GAISFSFSLHH75 pKa = 5.94MPPILPPDD83 pKa = 4.4IISNNPFDD91 pKa = 5.09TIPDD95 pKa = 3.85TTTTTTTDD103 pKa = 3.13NEE105 pKa = 4.93SPFSITNDD113 pKa = 3.4GVPSLIDD120 pKa = 3.41GSMSIMDD127 pKa = 3.66TTEE130 pKa = 3.35ISAEE134 pKa = 4.06SDD136 pKa = 3.21TTPDD140 pKa = 4.05DD141 pKa = 3.69NPFDD145 pKa = 4.03VDD147 pKa = 3.79LSTRR151 pKa = 11.84VPLSTIPTLSPMEE164 pKa = 5.04DD165 pKa = 3.59DD166 pKa = 4.43NNNILTPSPSVDD178 pKa = 3.34PFSGLWDD185 pKa = 3.99LDD187 pKa = 3.49IPGAFSMSMSLSMMSMSVGYY207 pKa = 9.84FDD209 pKa = 5.32HH210 pKa = 7.7SEE212 pKa = 4.06GLPDD216 pKa = 4.92FPFSDD221 pKa = 4.08FSMPMMSMSMDD232 pKa = 5.18DD233 pKa = 4.14IVSMACPSSCTTSFCEE249 pKa = 3.8CTYY252 pKa = 10.01MEE254 pKa = 4.86EE255 pKa = 4.39VEE257 pKa = 4.77ADD259 pKa = 4.52CIPQIVNEE267 pKa = 4.31CSITQPKK274 pKa = 8.59SQCLVDD280 pKa = 5.07LFDD283 pKa = 4.32NGVGEE288 pKa = 4.84SSDD291 pKa = 3.38IFCNSAVCLGEE302 pKa = 4.16GKK304 pKa = 9.96SEE306 pKa = 4.11LEE308 pKa = 3.56CRR310 pKa = 11.84YY311 pKa = 10.3RR312 pKa = 11.84GVCFAMEE319 pKa = 4.64EE320 pKa = 4.04EE321 pKa = 5.04GGWNTIIGLSLSMSFSMSVSLTEE344 pKa = 4.12TTVTTVVPSPSFGGLTMIPTSCYY367 pKa = 10.33TFDD370 pKa = 3.97SDD372 pKa = 4.71
Molecular weight: 40.28 kDa
Isoelectric point according different methods:
Protein with the highest isoelectric point:
>tr|B5YLN3|B5YLN3_THAPS Aminopeptidase OS=Thalassiosira pseudonana OX=35128 GN=THAPS_269937 PE=3 SV=1
MM1 pKa = 7.5TKK3 pKa = 9.06RR4 pKa = 11.84TLSNKK9 pKa = 7.81TRR11 pKa = 11.84SSILKK16 pKa = 9.43VSGFRR21 pKa = 11.84ARR23 pKa = 11.84MATAQGRR30 pKa = 11.84KK31 pKa = 8.94IIRR34 pKa = 11.84TRR36 pKa = 11.84RR37 pKa = 11.84QKK39 pKa = 10.56GRR41 pKa = 11.84KK42 pKa = 8.67KK43 pKa = 10.47LAIPRR48 pKa = 3.95
MM1 pKa = 7.5TKK3 pKa = 9.06RR4 pKa = 11.84TLSNKK9 pKa = 7.81TRR11 pKa = 11.84SSILKK16 pKa = 9.43VSGFRR21 pKa = 11.84ARR23 pKa = 11.84MATAQGRR30 pKa = 11.84KK31 pKa = 8.94IIRR34 pKa = 11.84TRR36 pKa = 11.84RR37 pKa = 11.84QKK39 pKa = 10.56GRR41 pKa = 11.84KK42 pKa = 8.67KK43 pKa = 10.47LAIPRR48 pKa = 3.95
Molecular weight: 5.55 kDa
Isoelectric point according different methods:
Peptides (in silico digests for buttom-up proteomics)
Below you can find in silico digests of the whole proteome with Trypsin, Chymotrypsin, Trypsin+LysC, LysN, ArgC proteases suitable for different mass spec machines.| Try ESI |
 |
|---|
| ChTry ESI |
 |
|---|
| ArgC ESI |
 |
|---|
| LysN ESI |
 |
|---|
| TryLysC ESI |
 |
|---|
| Try MALDI |
 |
|---|
| ChTry MALDI |
 |
|---|
| ArgC MALDI |
 |
|---|
| LysN MALDI |
 |
|---|
| TryLysC MALDI |
 |
|---|
| Try LTQ |
 |
|---|
| ChTry LTQ |
 |
|---|
| ArgC LTQ |
 |
|---|
| LysN LTQ |
 |
|---|
| TryLysC LTQ |
 |
|---|
| Try MSlow |
 |
|---|
| ChTry MSlow |
 |
|---|
| ArgC MSlow |
 |
|---|
| LysN MSlow |
 |
|---|
| TryLysC MSlow |
 |
|---|
| Try MShigh |
 |
|---|
| ChTry MShigh |
 |
|---|
| ArgC MShigh |
 |
|---|
| LysN MShigh |
 |
|---|
| TryLysC MShigh |
 |
|---|
General Statistics
Number of major isoforms |
Number of additional isoforms |
Number of all proteins |
Number of amino acids |
Min. Seq. Length |
Max. Seq. Length |
Avg. Seq. Length |
Avg. Mol. Weight |
|---|---|---|---|---|---|---|---|
5824029 |
29 |
8463 |
497.0 |
54.81 |
Amino acid frequency
Ala |
Cys |
Asp |
Glu |
Phe |
Gly |
His |
Ile |
Lys |
Leu |
|---|---|---|---|---|---|---|---|---|---|
7.707 ± 0.019 | 1.618 ± 0.01 |
6.285 ± 0.019 | 6.557 ± 0.022 |
3.487 ± 0.017 | 6.957 ± 0.023 |
2.315 ± 0.011 | 4.716 ± 0.017 |
5.367 ± 0.024 | 8.461 ± 0.026 |
Met |
Asn |
Gln |
Pro |
Arg |
Ser |
Thr |
Val |
Trp |
Tyr |
|---|---|---|---|---|---|---|---|---|---|
2.512 ± 0.01 | 4.55 ± 0.015 |
4.743 ± 0.022 | 3.783 ± 0.017 |
5.332 ± 0.024 | 9.382 ± 0.033 |
6.009 ± 0.016 | 6.429 ± 0.017 |
1.115 ± 0.007 | 2.676 ± 0.011 |
Most of the basic statistics you can see at this page can be downloaded from this CSV file
Proteome-pI is available under Creative Commons Attribution-NoDerivs license, for more details see here
| Reference: Kozlowski LP. Proteome-pI 2.0: Proteome Isoelectric Point Database Update. Nucleic Acids Res. 2021, doi: 10.1093/nar/gkab944 | Contact: Lukasz P. Kozlowski |
