Gemmobacter aestuarii
Taxonomy: cellular organisms; Bacteria; Proteobacteria; Alphaproteobacteria; Rhodobacterales; Rhodobacteraceae; Gemmobacter
Average proteome isoelectric point is 6.38
Get precalculated fractions of proteins
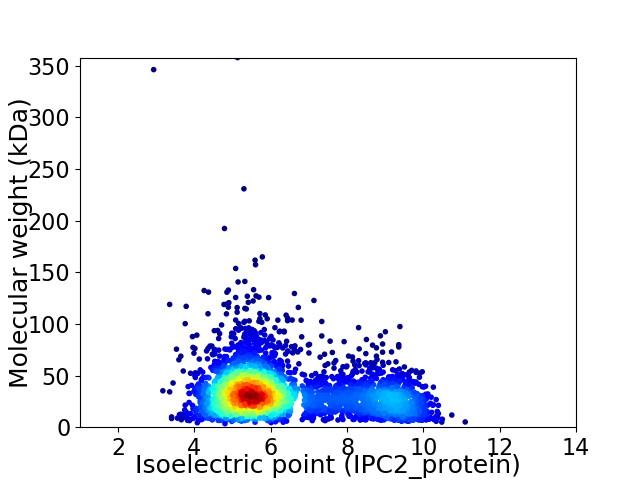
Virtual 2D-PAGE plot for 3480 proteins (isoelectric point calculated using IPC2_protein)
Get csv file with sequences according to given criteria:
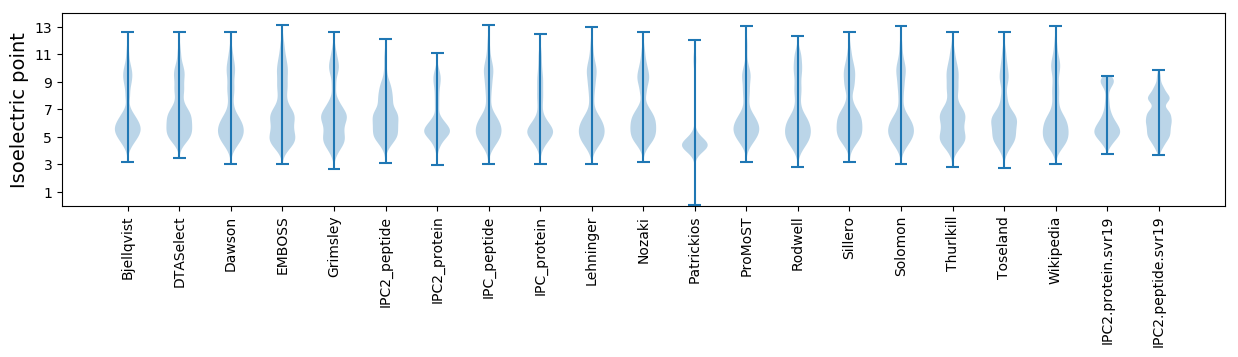
* You can choose from 21 different methods for calculating isoelectric point
Summary statistics related to proteome-wise predictions
Protein with the lowest isoelectric point:
>tr|A0A4S3MJC1|A0A4S3MJC1_9RHOB NAD-dependent protein deacylase OS=Gemmobacter aestuarii OX=1445661 GN=cobB PE=3 SV=1
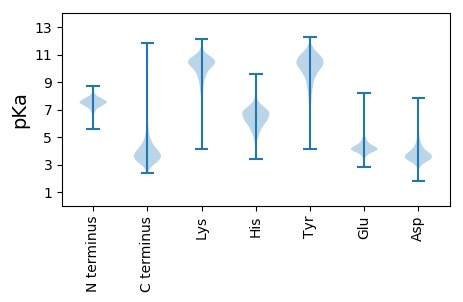
MM1 pKa = 7.36KK2 pKa = 10.35VHH4 pKa = 7.26VDD6 pKa = 3.0MSICLLHH13 pKa = 5.73GQCVIAAPQVFSFDD27 pKa = 4.17DD28 pKa = 3.61EE29 pKa = 5.34GGLVWLAEE37 pKa = 4.19VDD39 pKa = 3.5DD40 pKa = 4.28SLRR43 pKa = 11.84ADD45 pKa = 3.48VEE47 pKa = 4.37AASDD51 pKa = 3.75ACPEE55 pKa = 3.94QAIQLGDD62 pKa = 3.25
MM1 pKa = 7.36KK2 pKa = 10.35VHH4 pKa = 7.26VDD6 pKa = 3.0MSICLLHH13 pKa = 5.73GQCVIAAPQVFSFDD27 pKa = 4.17DD28 pKa = 3.61EE29 pKa = 5.34GGLVWLAEE37 pKa = 4.19VDD39 pKa = 3.5DD40 pKa = 4.28SLRR43 pKa = 11.84ADD45 pKa = 3.48VEE47 pKa = 4.37AASDD51 pKa = 3.75ACPEE55 pKa = 3.94QAIQLGDD62 pKa = 3.25
Molecular weight: 6.63 kDa
Isoelectric point according different methods:
Protein with the highest isoelectric point:
>tr|A0A4S3MT11|A0A4S3MT11_9RHOB Ribonuclease 3 OS=Gemmobacter aestuarii OX=1445661 GN=rnc PE=3 SV=1
MM1 pKa = 7.35KK2 pKa = 9.44RR3 pKa = 11.84TYY5 pKa = 10.31QPSNLVRR12 pKa = 11.84KK13 pKa = 9.18RR14 pKa = 11.84RR15 pKa = 11.84HH16 pKa = 4.42GFRR19 pKa = 11.84ARR21 pKa = 11.84MATKK25 pKa = 10.34GGRR28 pKa = 11.84LVLAARR34 pKa = 11.84RR35 pKa = 11.84AKK37 pKa = 10.1GRR39 pKa = 11.84KK40 pKa = 8.83KK41 pKa = 10.63LSAA44 pKa = 3.95
MM1 pKa = 7.35KK2 pKa = 9.44RR3 pKa = 11.84TYY5 pKa = 10.31QPSNLVRR12 pKa = 11.84KK13 pKa = 9.18RR14 pKa = 11.84RR15 pKa = 11.84HH16 pKa = 4.42GFRR19 pKa = 11.84ARR21 pKa = 11.84MATKK25 pKa = 10.34GGRR28 pKa = 11.84LVLAARR34 pKa = 11.84RR35 pKa = 11.84AKK37 pKa = 10.1GRR39 pKa = 11.84KK40 pKa = 8.83KK41 pKa = 10.63LSAA44 pKa = 3.95
Molecular weight: 5.08 kDa
Isoelectric point according different methods:
Peptides (in silico digests for buttom-up proteomics)
Below you can find in silico digests of the whole proteome with Trypsin, Chymotrypsin, Trypsin+LysC, LysN, ArgC proteases suitable for different mass spec machines.| Try ESI |
 |
|---|
| ChTry ESI |
|
|---|
| ArgC ESI |
|
|---|
| LysN ESI |
|
|---|
| TryLysC ESI |
|
|---|
| Try MALDI |
|
|---|
| ChTry MALDI |
|
|---|
| ArgC MALDI |
|
|---|
| LysN MALDI |
|
|---|
| TryLysC MALDI |
|
|---|
| Try LTQ |
|
|---|
| ChTry LTQ |
|
|---|
| ArgC LTQ |
|
|---|
| LysN LTQ |
|
|---|
| TryLysC LTQ |
|
|---|
| Try MSlow |
|
|---|
| ChTry MSlow |
|
|---|
| ArgC MSlow |
|
|---|
| LysN MSlow |
|
|---|
| TryLysC MSlow |
|
|---|
| Try MShigh |
|
|---|
| ChTry MShigh |
|
|---|
| ArgC MShigh |
|
|---|
| LysN MShigh |
|
|---|
| TryLysC MShigh |
|
|---|
General Statistics
Number of major isoforms |
Number of additional isoforms |
Number of all proteins |
Number of amino acids |
Min. Seq. Length |
Max. Seq. Length |
Avg. Seq. Length |
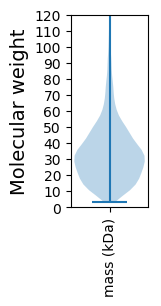
Avg. Mol. Weight |
|---|---|---|---|---|---|---|---|
0 |
1136179 |
33 |
3465 |
326.5 |
35.2 |
Amino acid frequency
Ala |
Cys |
Asp |
Glu |
Phe |
Gly |
His |
Ile |
Lys |
Leu |
|---|---|---|---|---|---|---|---|---|---|
13.48 ± 0.066 | 0.869 ± 0.013 |
5.957 ± 0.045 | 5.539 ± 0.035 |
3.652 ± 0.026 | 9.332 ± 0.056 |
2.045 ± 0.022 | 4.929 ± 0.025 |
2.616 ± 0.032 | 10.114 ± 0.048 |
Met |
Asn |
Gln |
Pro |
Arg |
Ser |
Thr |
Val |
Trp |
Tyr |
|---|---|---|---|---|---|---|---|---|---|
2.741 ± 0.02 | 2.325 ± 0.023 |
5.451 ± 0.036 | 2.804 ± 0.019 |
7.446 ± 0.04 | 4.512 ± 0.025 |
5.33 ± 0.032 | 7.387 ± 0.033 |
1.447 ± 0.02 | 2.023 ± 0.017 |
Most of the basic statistics you can see at this page can be downloaded from this CSV file
See this proteome in:

Proteome-pI is available under Creative Commons Attribution-NoDerivs license, for more details see here
| Reference: Kozlowski LP. Proteome-pI 2.0: Proteome Isoelectric Point Database Update. Nucleic Acids Res. 2021, doi: 10.1093/nar/gkab944 | Contact: Lukasz P. Kozlowski |