Stenotrophomonas phage S1
Taxonomy: Viruses; Duplodnaviria; Heunggongvirae; Uroviricota; Caudoviricetes; Caudovirales; Siphoviridae; unclassified Siphoviridae
Average proteome isoelectric point is 7.02
Get precalculated fractions of proteins

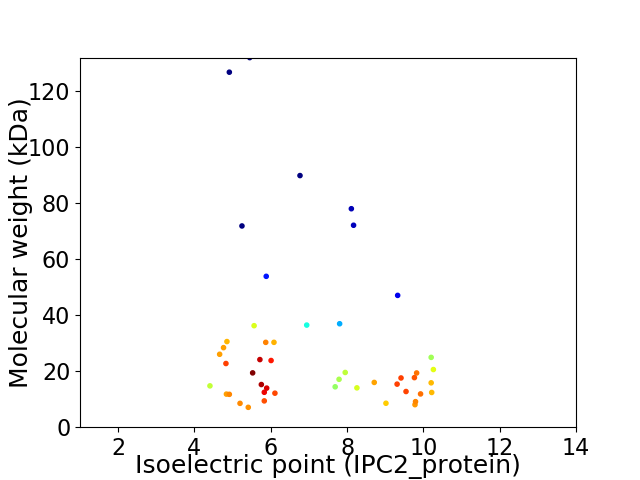
Virtual 2D-PAGE plot for 48 proteins (isoelectric point calculated using IPC2_protein)
Get csv file with sequences according to given criteria:
* You can choose from 21 different methods for calculating isoelectric point
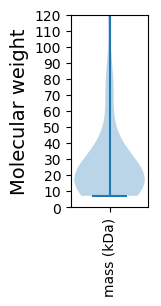
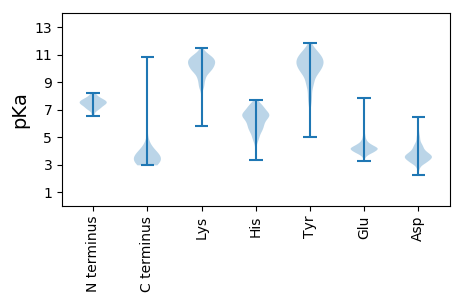
Summary statistics related to proteome-wise predictions


Protein with the lowest isoelectric point:
>tr|B7SYE5|B7SYE5_9CAUD Gp15 OS=Stenotrophomonas phage S1 OX=573591 PE=4 SV=1
MM1 pKa = 7.05IQASAGFLTDD11 pKa = 3.42IGAGLIVVDD20 pKa = 4.75DD21 pKa = 4.62AEE23 pKa = 4.84LGEE26 pKa = 4.72DD27 pKa = 3.45QSGPATLISVQQLSRR42 pKa = 11.84TGGGSAQVTSDD53 pKa = 3.09ASVTIEE59 pKa = 3.82FEE61 pKa = 4.29VPRR64 pKa = 11.84EE65 pKa = 4.03SGEE68 pKa = 3.97VNPRR72 pKa = 11.84LLVHH76 pKa = 6.81RR77 pKa = 11.84ARR79 pKa = 11.84YY80 pKa = 9.59DD81 pKa = 3.99LIRR84 pKa = 11.84VLTFNDD90 pKa = 3.04KK91 pKa = 10.7LLPKK95 pKa = 10.56GITTFEE101 pKa = 4.21LLQSQMATLEE111 pKa = 4.28DD112 pKa = 4.25DD113 pKa = 4.29AGHH116 pKa = 6.05SAVVAQITARR126 pKa = 11.84AGLTEE131 pKa = 4.11TFEE134 pKa = 4.38PVPNPP139 pKa = 3.42
MM1 pKa = 7.05IQASAGFLTDD11 pKa = 3.42IGAGLIVVDD20 pKa = 4.75DD21 pKa = 4.62AEE23 pKa = 4.84LGEE26 pKa = 4.72DD27 pKa = 3.45QSGPATLISVQQLSRR42 pKa = 11.84TGGGSAQVTSDD53 pKa = 3.09ASVTIEE59 pKa = 3.82FEE61 pKa = 4.29VPRR64 pKa = 11.84EE65 pKa = 4.03SGEE68 pKa = 3.97VNPRR72 pKa = 11.84LLVHH76 pKa = 6.81RR77 pKa = 11.84ARR79 pKa = 11.84YY80 pKa = 9.59DD81 pKa = 3.99LIRR84 pKa = 11.84VLTFNDD90 pKa = 3.04KK91 pKa = 10.7LLPKK95 pKa = 10.56GITTFEE101 pKa = 4.21LLQSQMATLEE111 pKa = 4.28DD112 pKa = 4.25DD113 pKa = 4.29AGHH116 pKa = 6.05SAVVAQITARR126 pKa = 11.84AGLTEE131 pKa = 4.11TFEE134 pKa = 4.38PVPNPP139 pKa = 3.42
Molecular weight: 14.73 kDa
Isoelectric point according different methods:
Protein with the highest isoelectric point:
>tr|B7SYG8|B7SYG8_9CAUD Gp38 OS=Stenotrophomonas phage S1 OX=573591 PE=4 SV=1
MM1 pKa = 7.59SARR4 pKa = 11.84PQQIGRR10 pKa = 11.84AAEE13 pKa = 3.95VRR15 pKa = 11.84KK16 pKa = 9.65VLSMFPQGATVEE28 pKa = 4.3QIKK31 pKa = 8.11TAGRR35 pKa = 11.84INSTHH40 pKa = 5.1QAIGYY45 pKa = 4.99TLKK48 pKa = 10.85GLARR52 pKa = 11.84SGQAICHH59 pKa = 6.1RR60 pKa = 11.84SGVRR64 pKa = 11.84GIWRR68 pKa = 11.84LSSHH72 pKa = 5.46TQHH75 pKa = 7.27AIAPLRR81 pKa = 11.84AAPARR86 pKa = 11.84EE87 pKa = 3.88RR88 pKa = 11.84PTCVVGPLTGVSDD101 pKa = 3.78AATTIRR107 pKa = 11.84HH108 pKa = 6.0RR109 pKa = 11.84EE110 pKa = 3.77LDD112 pKa = 3.81RR113 pKa = 11.84QQLADD118 pKa = 4.64DD119 pKa = 5.0LDD121 pKa = 4.41AFLAAGGHH129 pKa = 5.91IEE131 pKa = 4.38VLGHH135 pKa = 5.52TPLRR139 pKa = 11.84PLMSRR144 pKa = 11.84HH145 pKa = 4.86TANHH149 pKa = 5.53GSYY152 pKa = 10.42AEE154 pKa = 3.99RR155 pKa = 11.84MAAHH159 pKa = 6.79EE160 pKa = 4.17MDD162 pKa = 3.44
MM1 pKa = 7.59SARR4 pKa = 11.84PQQIGRR10 pKa = 11.84AAEE13 pKa = 3.95VRR15 pKa = 11.84KK16 pKa = 9.65VLSMFPQGATVEE28 pKa = 4.3QIKK31 pKa = 8.11TAGRR35 pKa = 11.84INSTHH40 pKa = 5.1QAIGYY45 pKa = 4.99TLKK48 pKa = 10.85GLARR52 pKa = 11.84SGQAICHH59 pKa = 6.1RR60 pKa = 11.84SGVRR64 pKa = 11.84GIWRR68 pKa = 11.84LSSHH72 pKa = 5.46TQHH75 pKa = 7.27AIAPLRR81 pKa = 11.84AAPARR86 pKa = 11.84EE87 pKa = 3.88RR88 pKa = 11.84PTCVVGPLTGVSDD101 pKa = 3.78AATTIRR107 pKa = 11.84HH108 pKa = 6.0RR109 pKa = 11.84EE110 pKa = 3.77LDD112 pKa = 3.81RR113 pKa = 11.84QQLADD118 pKa = 4.64DD119 pKa = 5.0LDD121 pKa = 4.41AFLAAGGHH129 pKa = 5.91IEE131 pKa = 4.38VLGHH135 pKa = 5.52TPLRR139 pKa = 11.84PLMSRR144 pKa = 11.84HH145 pKa = 4.86TANHH149 pKa = 5.53GSYY152 pKa = 10.42AEE154 pKa = 3.99RR155 pKa = 11.84MAAHH159 pKa = 6.79EE160 pKa = 4.17MDD162 pKa = 3.44
Molecular weight: 17.55 kDa
Isoelectric point according different methods:
Peptides (in silico digests for buttom-up proteomics)
Below you can find in silico digests of the whole proteome with Trypsin, Chymotrypsin, Trypsin+LysC, LysN, ArgC proteases suitable for different mass spec machines.| Try ESI |
 |
|---|
| ChTry ESI |
 |
|---|
| ArgC ESI |
 |
|---|
| LysN ESI |
 |
|---|
| TryLysC ESI |
 |
|---|
| Try MALDI |
 |
|---|
| ChTry MALDI |
 |
|---|
| ArgC MALDI |
 |
|---|
| LysN MALDI |
 |
|---|
| TryLysC MALDI |
 |
|---|
| Try LTQ |
 |
|---|
| ChTry LTQ |
 |
|---|
| ArgC LTQ |
 |
|---|
| LysN LTQ |
 |
|---|
| TryLysC LTQ |
 |
|---|
| Try MSlow |
 |
|---|
| ChTry MSlow |
 |
|---|
| ArgC MSlow |
 |
|---|
| LysN MSlow |
 |
|---|
| TryLysC MSlow |
 |
|---|
| Try MShigh |
 |
|---|
| ChTry MShigh |
 |
|---|
| ArgC MShigh |
 |
|---|
| LysN MShigh |
 |
|---|
| TryLysC MShigh |
 |
|---|
General Statistics
Number of major isoforms |
Number of additional isoforms |
Number of all proteins |
Number of amino acids |
Min. Seq. Length |
Max. Seq. Length |
Avg. Seq. Length |
Avg. Mol. Weight |
|---|---|---|---|---|---|---|---|
0 |
12930 |
69 |
1248 |
269.4 |
29.31 |
Amino acid frequency
Ala |
Cys |
Asp |
Glu |
Phe |
Gly |
His |
Ile |
Lys |
Leu |
|---|---|---|---|---|---|---|---|---|---|
12.908 ± 0.769 | 1.114 ± 0.216 |
5.731 ± 0.255 | 5.352 ± 0.346 |
2.56 ± 0.176 | 8.268 ± 0.356 |
1.91 ± 0.207 | 3.859 ± 0.221 |
3.155 ± 0.29 | 8.577 ± 0.288 |
Met |
Asn |
Gln |
Pro |
Arg |
Ser |
Thr |
Val |
Trp |
Tyr |
|---|---|---|---|---|---|---|---|---|---|
2.196 ± 0.138 | 2.738 ± 0.165 |
5.391 ± 0.454 | 4.47 ± 0.362 |
8.484 ± 0.471 | 6.551 ± 0.373 |
5.53 ± 0.319 | 7.108 ± 0.374 |
1.895 ± 0.158 | 2.204 ± 0.185 |
Most of the basic statistics you can see at this page can be downloaded from this CSV file
Proteome-pI is available under Creative Commons Attribution-NoDerivs license, for more details see here
| Reference: Kozlowski LP. Proteome-pI 2.0: Proteome Isoelectric Point Database Update. Nucleic Acids Res. 2021, doi: 10.1093/nar/gkab944 | Contact: Lukasz P. Kozlowski |
