Pontibaca methylaminivorans
Taxonomy: cellular organisms; Bacteria; Proteobacteria; Alphaproteobacteria; Rhodobacterales; Roseobacteraceae; Pontibaca
Average proteome isoelectric point is 6.41
Get precalculated fractions of proteins

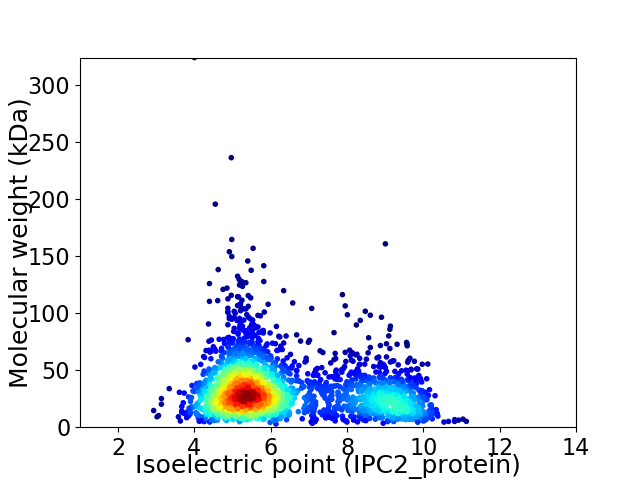
Virtual 2D-PAGE plot for 2497 proteins (isoelectric point calculated using IPC2_protein)
Get csv file with sequences according to given criteria:
* You can choose from 21 different methods for calculating isoelectric point
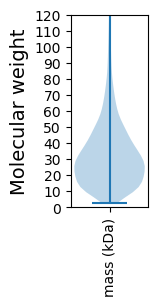
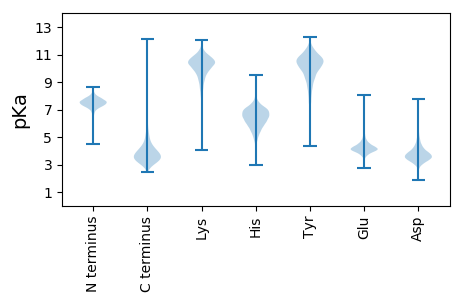
Summary statistics related to proteome-wise predictions


Protein with the lowest isoelectric point:
>tr|A0A1R3WYW4|A0A1R3WYW4_9RHOB Glycosyl transferase family 25 OS=Pontibaca methylaminivorans OX=515897 GN=SAMN05421849_1883 PE=4 SV=1
MM1 pKa = 7.16TRR3 pKa = 11.84MLTTLAAAGALALAAGAASAEE24 pKa = 4.32DD25 pKa = 3.93GTWTVEE31 pKa = 3.97FMPMNADD38 pKa = 3.54TAGSEE43 pKa = 4.26AAGTATLTAAGDD55 pKa = 3.78TLTIRR60 pKa = 11.84VDD62 pKa = 3.46ATGTTPGIVHH72 pKa = 6.85LQHH75 pKa = 6.12FHH77 pKa = 6.19GFAEE81 pKa = 4.57GDD83 pKa = 3.64EE84 pKa = 4.85SSTCPGLDD92 pKa = 3.97ADD94 pKa = 4.76TNDD97 pKa = 4.9DD98 pKa = 4.48GIIDD102 pKa = 5.22LIEE105 pKa = 4.19TEE107 pKa = 4.3PAAGTTMVPFHH118 pKa = 7.22GDD120 pKa = 3.39PASMAIEE127 pKa = 4.14AEE129 pKa = 4.65GYY131 pKa = 7.02PTADD135 pKa = 3.54DD136 pKa = 3.75EE137 pKa = 4.69GAYY140 pKa = 10.24SYY142 pKa = 9.95EE143 pKa = 4.33QEE145 pKa = 4.16VSLPDD150 pKa = 3.61LEE152 pKa = 4.85AAFAEE157 pKa = 4.38AFPGQEE163 pKa = 3.6LDD165 pKa = 3.35FGRR168 pKa = 11.84RR169 pKa = 11.84VVFLHH174 pKa = 6.48GVAEE178 pKa = 4.56GTDD181 pKa = 3.74LPDD184 pKa = 3.66TVQSLGDD191 pKa = 3.66VPAHH195 pKa = 4.83VTLPIACGVLEE206 pKa = 4.48AAAEE210 pKa = 4.03
MM1 pKa = 7.16TRR3 pKa = 11.84MLTTLAAAGALALAAGAASAEE24 pKa = 4.32DD25 pKa = 3.93GTWTVEE31 pKa = 3.97FMPMNADD38 pKa = 3.54TAGSEE43 pKa = 4.26AAGTATLTAAGDD55 pKa = 3.78TLTIRR60 pKa = 11.84VDD62 pKa = 3.46ATGTTPGIVHH72 pKa = 6.85LQHH75 pKa = 6.12FHH77 pKa = 6.19GFAEE81 pKa = 4.57GDD83 pKa = 3.64EE84 pKa = 4.85SSTCPGLDD92 pKa = 3.97ADD94 pKa = 4.76TNDD97 pKa = 4.9DD98 pKa = 4.48GIIDD102 pKa = 5.22LIEE105 pKa = 4.19TEE107 pKa = 4.3PAAGTTMVPFHH118 pKa = 7.22GDD120 pKa = 3.39PASMAIEE127 pKa = 4.14AEE129 pKa = 4.65GYY131 pKa = 7.02PTADD135 pKa = 3.54DD136 pKa = 3.75EE137 pKa = 4.69GAYY140 pKa = 10.24SYY142 pKa = 9.95EE143 pKa = 4.33QEE145 pKa = 4.16VSLPDD150 pKa = 3.61LEE152 pKa = 4.85AAFAEE157 pKa = 4.38AFPGQEE163 pKa = 3.6LDD165 pKa = 3.35FGRR168 pKa = 11.84RR169 pKa = 11.84VVFLHH174 pKa = 6.48GVAEE178 pKa = 4.56GTDD181 pKa = 3.74LPDD184 pKa = 3.66TVQSLGDD191 pKa = 3.66VPAHH195 pKa = 4.83VTLPIACGVLEE206 pKa = 4.48AAAEE210 pKa = 4.03
Molecular weight: 21.43 kDa
Isoelectric point according different methods:
Protein with the highest isoelectric point:
>tr|A0A1R3WEX8|A0A1R3WEX8_9RHOB Uncharacterized protein OS=Pontibaca methylaminivorans OX=515897 GN=SAMN05421849_0523 PE=4 SV=1
MM1 pKa = 7.14NRR3 pKa = 11.84LVTMILRR10 pKa = 11.84IALRR14 pKa = 11.84RR15 pKa = 11.84LVSSGVNHH23 pKa = 7.91GIRR26 pKa = 11.84AAASRR31 pKa = 11.84GGRR34 pKa = 11.84AAANDD39 pKa = 3.61VTRR42 pKa = 11.84GRR44 pKa = 11.84AGGAFGNQRR53 pKa = 11.84RR54 pKa = 11.84TMRR57 pKa = 11.84LLRR60 pKa = 11.84LLRR63 pKa = 11.84RR64 pKa = 3.9
MM1 pKa = 7.14NRR3 pKa = 11.84LVTMILRR10 pKa = 11.84IALRR14 pKa = 11.84RR15 pKa = 11.84LVSSGVNHH23 pKa = 7.91GIRR26 pKa = 11.84AAASRR31 pKa = 11.84GGRR34 pKa = 11.84AAANDD39 pKa = 3.61VTRR42 pKa = 11.84GRR44 pKa = 11.84AGGAFGNQRR53 pKa = 11.84RR54 pKa = 11.84TMRR57 pKa = 11.84LLRR60 pKa = 11.84LLRR63 pKa = 11.84RR64 pKa = 3.9
Molecular weight: 7.04 kDa
Isoelectric point according different methods:
Peptides (in silico digests for buttom-up proteomics)
Below you can find in silico digests of the whole proteome with Trypsin, Chymotrypsin, Trypsin+LysC, LysN, ArgC proteases suitable for different mass spec machines.| Try ESI |
 |
|---|
| ChTry ESI |
 |
|---|
| ArgC ESI |
 |
|---|
| LysN ESI |
 |
|---|
| TryLysC ESI |
 |
|---|
| Try MALDI |
 |
|---|
| ChTry MALDI |
 |
|---|
| ArgC MALDI |
 |
|---|
| LysN MALDI |
 |
|---|
| TryLysC MALDI |
 |
|---|
| Try LTQ |
 |
|---|
| ChTry LTQ |
 |
|---|
| ArgC LTQ |
 |
|---|
| LysN LTQ |
 |
|---|
| TryLysC LTQ |
 |
|---|
| Try MSlow |
 |
|---|
| ChTry MSlow |
 |
|---|
| ArgC MSlow |
 |
|---|
| LysN MSlow |
 |
|---|
| TryLysC MSlow |
 |
|---|
| Try MShigh |
 |
|---|
| ChTry MShigh |
 |
|---|
| ArgC MShigh |
 |
|---|
| LysN MShigh |
 |
|---|
| TryLysC MShigh |
 |
|---|
General Statistics
Number of major isoforms |
Number of additional isoforms |
Number of all proteins |
Number of amino acids |
Min. Seq. Length |
Max. Seq. Length |
Avg. Seq. Length |
Avg. Mol. Weight |
|---|---|---|---|---|---|---|---|
0 |
785412 |
25 |
3159 |
314.5 |
34.14 |
Amino acid frequency
Ala |
Cys |
Asp |
Glu |
Phe |
Gly |
His |
Ile |
Lys |
Leu |
|---|---|---|---|---|---|---|---|---|---|
12.925 ± 0.071 | 0.858 ± 0.016 |
6.031 ± 0.042 | 6.155 ± 0.041 |
3.489 ± 0.032 | 9.032 ± 0.047 |
2.146 ± 0.023 | 5.025 ± 0.033 |
2.324 ± 0.036 | 10.382 ± 0.067 |
Met |
Asn |
Gln |
Pro |
Arg |
Ser |
Thr |
Val |
Trp |
Tyr |
|---|---|---|---|---|---|---|---|---|---|
2.652 ± 0.025 | 2.282 ± 0.026 |
5.428 ± 0.032 | 2.925 ± 0.025 |
8.201 ± 0.045 | 4.919 ± 0.03 |
4.925 ± 0.035 | 6.892 ± 0.043 |
1.374 ± 0.023 | 2.034 ± 0.025 |
Most of the basic statistics you can see at this page can be downloaded from this CSV file
Proteome-pI is available under Creative Commons Attribution-NoDerivs license, for more details see here
| Reference: Kozlowski LP. Proteome-pI 2.0: Proteome Isoelectric Point Database Update. Nucleic Acids Res. 2021, doi: 10.1093/nar/gkab944 | Contact: Lukasz P. Kozlowski |
