Flavonifractor plautii ATCC 29863
Taxonomy: cellular organisms; Bacteria; Terrabacteria group; Firmicutes; Clostridia; Eubacteriales; Oscillospiraceae; Flavonifractor; Flavonifractor plautii
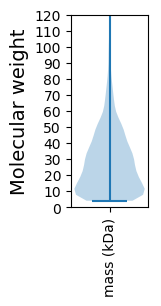
Average proteome isoelectric point is 6.34
Get precalculated fractions of proteins

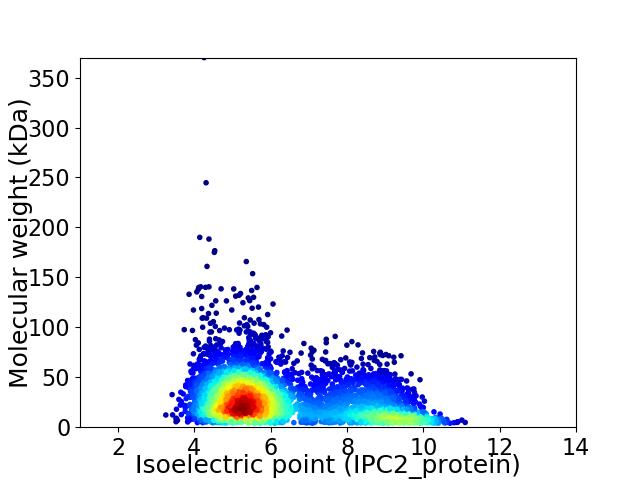
Virtual 2D-PAGE plot for 4278 proteins (isoelectric point calculated using IPC2_protein)
Get csv file with sequences according to given criteria:
* You can choose from 21 different methods for calculating isoelectric point
Summary statistics related to proteome-wise predictions


Protein with the lowest isoelectric point:
>tr|G9YSZ6|G9YSZ6_FLAPL Uncharacterized protein OS=Flavonifractor plautii ATCC 29863 OX=411475 GN=HMPREF0372_02655 PE=4 SV=1
MM1 pKa = 7.28KK2 pKa = 10.01RR3 pKa = 11.84YY4 pKa = 9.47KK5 pKa = 10.2RR6 pKa = 11.84LYY8 pKa = 9.49VVLAVLLAACIATFALSRR26 pKa = 11.84YY27 pKa = 8.67KK28 pKa = 10.46AQKK31 pKa = 9.93EE32 pKa = 4.03QIQTSGEE39 pKa = 4.28TILSISADD47 pKa = 3.71EE48 pKa = 4.44VEE50 pKa = 4.51SLSWDD55 pKa = 3.36YY56 pKa = 11.76DD57 pKa = 3.54GQTLSFHH64 pKa = 7.47RR65 pKa = 11.84DD66 pKa = 3.33GAWSYY71 pKa = 12.05DD72 pKa = 3.51DD73 pKa = 5.67DD74 pKa = 4.57AAFPVDD80 pKa = 3.75AEE82 pKa = 4.25QMNLLLEE89 pKa = 4.26PFAAFGAAFIIEE101 pKa = 4.49DD102 pKa = 3.89VDD104 pKa = 4.92DD105 pKa = 4.69LGQYY109 pKa = 11.01GLDD112 pKa = 3.57NPVCTIRR119 pKa = 11.84ITAGGEE125 pKa = 3.78THH127 pKa = 7.53TIQLGDD133 pKa = 3.94YY134 pKa = 10.65SKK136 pKa = 10.58MDD138 pKa = 3.28AQRR141 pKa = 11.84YY142 pKa = 7.44VSIGDD147 pKa = 3.6GNVYY151 pKa = 10.24LAAHH155 pKa = 7.02DD156 pKa = 4.58PLDD159 pKa = 4.17EE160 pKa = 4.76FDD162 pKa = 3.63VTLDD166 pKa = 3.66EE167 pKa = 6.83LIDD170 pKa = 3.82QDD172 pKa = 5.31DD173 pKa = 3.89IPAFGQVSEE182 pKa = 4.68LRR184 pKa = 11.84FSGAEE189 pKa = 3.9NYY191 pKa = 9.78AVSYY195 pKa = 10.98QEE197 pKa = 5.66DD198 pKa = 3.51GGNTYY203 pKa = 10.6RR204 pKa = 11.84EE205 pKa = 3.89DD206 pKa = 3.22DD207 pKa = 3.91VYY209 pKa = 10.48FTEE212 pKa = 5.16RR213 pKa = 11.84DD214 pKa = 3.64GAQVPLDD221 pKa = 3.68PDD223 pKa = 3.21RR224 pKa = 11.84VEE226 pKa = 6.06DD227 pKa = 3.87YY228 pKa = 10.99LQAIQSLSLTDD239 pKa = 3.71CVTYY243 pKa = 10.59SANDD247 pKa = 4.67DD248 pKa = 3.67ISSPAAWTAPSS259 pKa = 3.32
MM1 pKa = 7.28KK2 pKa = 10.01RR3 pKa = 11.84YY4 pKa = 9.47KK5 pKa = 10.2RR6 pKa = 11.84LYY8 pKa = 9.49VVLAVLLAACIATFALSRR26 pKa = 11.84YY27 pKa = 8.67KK28 pKa = 10.46AQKK31 pKa = 9.93EE32 pKa = 4.03QIQTSGEE39 pKa = 4.28TILSISADD47 pKa = 3.71EE48 pKa = 4.44VEE50 pKa = 4.51SLSWDD55 pKa = 3.36YY56 pKa = 11.76DD57 pKa = 3.54GQTLSFHH64 pKa = 7.47RR65 pKa = 11.84DD66 pKa = 3.33GAWSYY71 pKa = 12.05DD72 pKa = 3.51DD73 pKa = 5.67DD74 pKa = 4.57AAFPVDD80 pKa = 3.75AEE82 pKa = 4.25QMNLLLEE89 pKa = 4.26PFAAFGAAFIIEE101 pKa = 4.49DD102 pKa = 3.89VDD104 pKa = 4.92DD105 pKa = 4.69LGQYY109 pKa = 11.01GLDD112 pKa = 3.57NPVCTIRR119 pKa = 11.84ITAGGEE125 pKa = 3.78THH127 pKa = 7.53TIQLGDD133 pKa = 3.94YY134 pKa = 10.65SKK136 pKa = 10.58MDD138 pKa = 3.28AQRR141 pKa = 11.84YY142 pKa = 7.44VSIGDD147 pKa = 3.6GNVYY151 pKa = 10.24LAAHH155 pKa = 7.02DD156 pKa = 4.58PLDD159 pKa = 4.17EE160 pKa = 4.76FDD162 pKa = 3.63VTLDD166 pKa = 3.66EE167 pKa = 6.83LIDD170 pKa = 3.82QDD172 pKa = 5.31DD173 pKa = 3.89IPAFGQVSEE182 pKa = 4.68LRR184 pKa = 11.84FSGAEE189 pKa = 3.9NYY191 pKa = 9.78AVSYY195 pKa = 10.98QEE197 pKa = 5.66DD198 pKa = 3.51GGNTYY203 pKa = 10.6RR204 pKa = 11.84EE205 pKa = 3.89DD206 pKa = 3.22DD207 pKa = 3.91VYY209 pKa = 10.48FTEE212 pKa = 5.16RR213 pKa = 11.84DD214 pKa = 3.64GAQVPLDD221 pKa = 3.68PDD223 pKa = 3.21RR224 pKa = 11.84VEE226 pKa = 6.06DD227 pKa = 3.87YY228 pKa = 10.99LQAIQSLSLTDD239 pKa = 3.71CVTYY243 pKa = 10.59SANDD247 pKa = 4.67DD248 pKa = 3.67ISSPAAWTAPSS259 pKa = 3.32
Molecular weight: 28.66 kDa
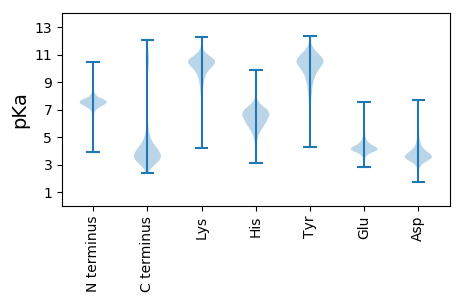
Isoelectric point according different methods:
Protein with the highest isoelectric point:
>tr|G9YTJ7|G9YTJ7_FLAPL Uncharacterized protein OS=Flavonifractor plautii ATCC 29863 OX=411475 GN=HMPREF0372_02857 PE=4 SV=1
MM1 pKa = 7.5KK2 pKa = 10.12KK3 pKa = 9.97FHH5 pKa = 5.45VTRR8 pKa = 11.84KK9 pKa = 7.37TVLTIVGVTLPLTAAAILLRR29 pKa = 11.84RR30 pKa = 11.84LKK32 pKa = 10.08RR33 pKa = 11.84SRR35 pKa = 11.84RR36 pKa = 11.84ARR38 pKa = 11.84SVRR41 pKa = 11.84AA42 pKa = 3.42
MM1 pKa = 7.5KK2 pKa = 10.12KK3 pKa = 9.97FHH5 pKa = 5.45VTRR8 pKa = 11.84KK9 pKa = 7.37TVLTIVGVTLPLTAAAILLRR29 pKa = 11.84RR30 pKa = 11.84LKK32 pKa = 10.08RR33 pKa = 11.84SRR35 pKa = 11.84RR36 pKa = 11.84ARR38 pKa = 11.84SVRR41 pKa = 11.84AA42 pKa = 3.42
Molecular weight: 4.79 kDa
Isoelectric point according different methods:
Peptides (in silico digests for buttom-up proteomics)
Below you can find in silico digests of the whole proteome with Trypsin, Chymotrypsin, Trypsin+LysC, LysN, ArgC proteases suitable for different mass spec machines.| Try ESI |
 |
|---|
| ChTry ESI |
 |
|---|
| ArgC ESI |
 |
|---|
| LysN ESI |
 |
|---|
| TryLysC ESI |
 |
|---|
| Try MALDI |
 |
|---|
| ChTry MALDI |
 |
|---|
| ArgC MALDI |
 |
|---|
| LysN MALDI |
 |
|---|
| TryLysC MALDI |
 |
|---|
| Try LTQ |
 |
|---|
| ChTry LTQ |
 |
|---|
| ArgC LTQ |
 |
|---|
| LysN LTQ |
 |
|---|
| TryLysC LTQ |
 |
|---|
| Try MSlow |
 |
|---|
| ChTry MSlow |
 |
|---|
| ArgC MSlow |
 |
|---|
| LysN MSlow |
 |
|---|
| TryLysC MSlow |
 |
|---|
| Try MShigh |
 |
|---|
| ChTry MShigh |
 |
|---|
| ArgC MShigh |
 |
|---|
| LysN MShigh |
 |
|---|
| TryLysC MShigh |
 |
|---|
General Statistics
Number of major isoforms |
Number of additional isoforms |
Number of all proteins |
Number of amino acids |
Min. Seq. Length |
Max. Seq. Length |
Avg. Seq. Length |
Avg. Mol. Weight |
|---|---|---|---|---|---|---|---|
0 |
1149482 |
37 |
3468 |
268.7 |
29.55 |
Amino acid frequency
Ala |
Cys |
Asp |
Glu |
Phe |
Gly |
His |
Ile |
Lys |
Leu |
|---|---|---|---|---|---|---|---|---|---|
10.234 ± 0.052 | 1.615 ± 0.02 |
5.35 ± 0.037 | 6.85 ± 0.042 |
3.681 ± 0.029 | 8.395 ± 0.04 |
1.834 ± 0.021 | 5.085 ± 0.034 |
4.169 ± 0.045 | 10.394 ± 0.058 |
Met |
Asn |
Gln |
Pro |
Arg |
Ser |
Thr |
Val |
Trp |
Tyr |
|---|---|---|---|---|---|---|---|---|---|
2.639 ± 0.02 | 3.058 ± 0.026 |
4.558 ± 0.031 | 3.388 ± 0.024 |
6.191 ± 0.045 | 5.319 ± 0.035 |
5.477 ± 0.039 | 7.231 ± 0.033 |
1.155 ± 0.014 | 3.377 ± 0.021 |
Most of the basic statistics you can see at this page can be downloaded from this CSV file
Proteome-pI is available under Creative Commons Attribution-NoDerivs license, for more details see here
| Reference: Kozlowski LP. Proteome-pI 2.0: Proteome Isoelectric Point Database Update. Nucleic Acids Res. 2021, doi: 10.1093/nar/gkab944 | Contact: Lukasz P. Kozlowski |
