Prevotella sp. oral taxon 473 str. F0040
Taxonomy: cellular organisms; Bacteria; FCB group; Bacteroidetes/Chlorobi group; Bacteroidetes; Bacteroidia; Bacteroidales; Prevotellaceae; Alloprevotella; Alloprevotella sp. oral taxon 473
Average proteome isoelectric point is 6.83
Get precalculated fractions of proteins
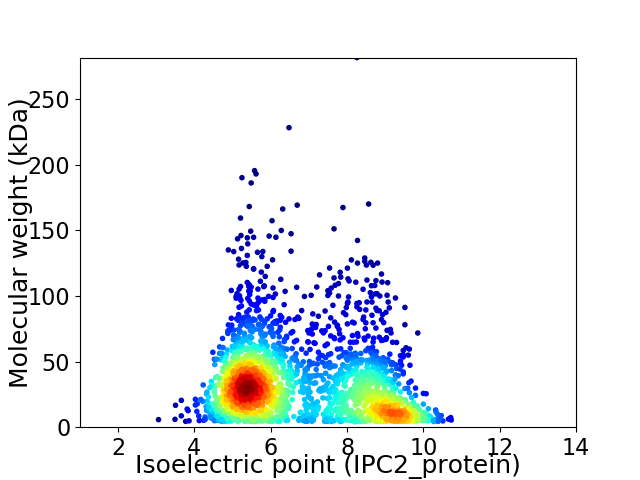
Virtual 2D-PAGE plot for 2316 proteins (isoelectric point calculated using IPC2_protein)
Get csv file with sequences according to given criteria:
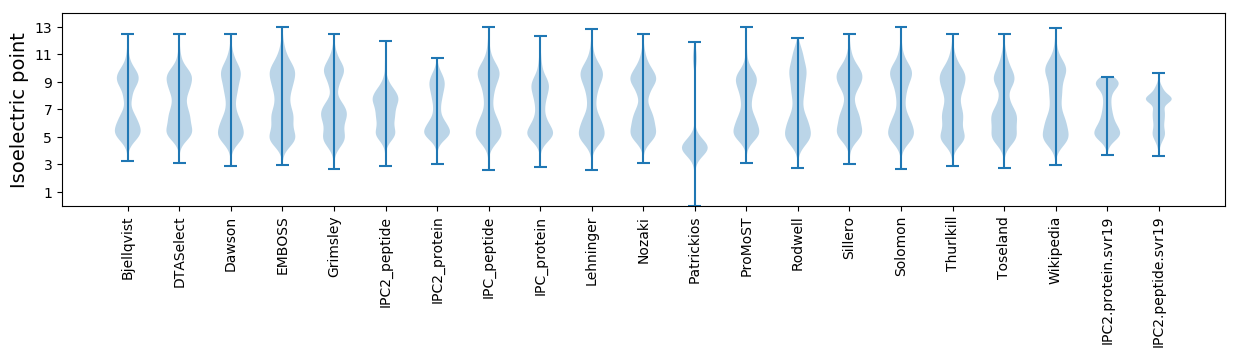
* You can choose from 21 different methods for calculating isoelectric point
Summary statistics related to proteome-wise predictions
Protein with the lowest isoelectric point:
>tr|L1MHT0|L1MHT0_9BACT Lipocalin-like domain-containing protein OS=Prevotella sp. oral taxon 473 str. F0040 OX=1035197 GN=HMPREF9999_01301 PE=4 SV=1
MM1 pKa = 7.6LLASCAVRR9 pKa = 11.84GKK11 pKa = 10.72YY12 pKa = 10.1SEE14 pKa = 5.5DD15 pKa = 3.44DD16 pKa = 3.78AEE18 pKa = 4.66TADD21 pKa = 3.9SAYY24 pKa = 9.2DD25 pKa = 3.61TSDD28 pKa = 3.34DD29 pKa = 3.98SQGNNHH35 pKa = 6.68DD36 pKa = 4.36AEE38 pKa = 5.22DD39 pKa = 4.02NFSGASSRR47 pKa = 11.84HH48 pKa = 5.29MDD50 pKa = 3.36SEE52 pKa = 4.59DD53 pKa = 3.68NEE55 pKa = 4.73GSSTMMSDD63 pKa = 3.0RR64 pKa = 11.84LSPEE68 pKa = 3.83DD69 pKa = 3.34EE70 pKa = 4.57AYY72 pKa = 9.85EE73 pKa = 4.38AGHH76 pKa = 5.58SQGYY80 pKa = 10.5DD81 pKa = 3.31DD82 pKa = 5.34GSADD86 pKa = 3.66AGTGSDD92 pKa = 3.62HH93 pKa = 5.89GTSFDD98 pKa = 4.56EE99 pKa = 4.56DD100 pKa = 2.91NKK102 pKa = 9.99YY103 pKa = 10.0QGKK106 pKa = 9.24AAEE109 pKa = 4.27QYY111 pKa = 10.69EE112 pKa = 4.27EE113 pKa = 5.32GYY115 pKa = 9.86NAGYY119 pKa = 10.74NEE121 pKa = 4.38GFNEE125 pKa = 4.14LTRR128 pKa = 4.63
MM1 pKa = 7.6LLASCAVRR9 pKa = 11.84GKK11 pKa = 10.72YY12 pKa = 10.1SEE14 pKa = 5.5DD15 pKa = 3.44DD16 pKa = 3.78AEE18 pKa = 4.66TADD21 pKa = 3.9SAYY24 pKa = 9.2DD25 pKa = 3.61TSDD28 pKa = 3.34DD29 pKa = 3.98SQGNNHH35 pKa = 6.68DD36 pKa = 4.36AEE38 pKa = 5.22DD39 pKa = 4.02NFSGASSRR47 pKa = 11.84HH48 pKa = 5.29MDD50 pKa = 3.36SEE52 pKa = 4.59DD53 pKa = 3.68NEE55 pKa = 4.73GSSTMMSDD63 pKa = 3.0RR64 pKa = 11.84LSPEE68 pKa = 3.83DD69 pKa = 3.34EE70 pKa = 4.57AYY72 pKa = 9.85EE73 pKa = 4.38AGHH76 pKa = 5.58SQGYY80 pKa = 10.5DD81 pKa = 3.31DD82 pKa = 5.34GSADD86 pKa = 3.66AGTGSDD92 pKa = 3.62HH93 pKa = 5.89GTSFDD98 pKa = 4.56EE99 pKa = 4.56DD100 pKa = 2.91NKK102 pKa = 9.99YY103 pKa = 10.0QGKK106 pKa = 9.24AAEE109 pKa = 4.27QYY111 pKa = 10.69EE112 pKa = 4.27EE113 pKa = 5.32GYY115 pKa = 9.86NAGYY119 pKa = 10.74NEE121 pKa = 4.38GFNEE125 pKa = 4.14LTRR128 pKa = 4.63
Molecular weight: 13.78 kDa
Isoelectric point according different methods:
Protein with the highest isoelectric point:
>tr|L1MAM7|L1MAM7_9BACT N-acetylglucosamine-6-phosphate deacetylase OS=Prevotella sp. oral taxon 473 str. F0040 OX=1035197 GN=HMPREF9999_02052 PE=3 SV=1
MM1 pKa = 7.34SVLRR5 pKa = 11.84FTARR9 pKa = 11.84LCLQRR14 pKa = 11.84YY15 pKa = 9.74DD16 pKa = 4.0EE17 pKa = 5.1FVTLQSSRR25 pKa = 11.84EE26 pKa = 3.86QQGNIGNFKK35 pKa = 10.62EE36 pKa = 4.32KK37 pKa = 9.15LTHH40 pKa = 7.16FIGSRR45 pKa = 11.84LRR47 pKa = 11.84ILSLFSSFAVCLAQRR62 pKa = 3.89
MM1 pKa = 7.34SVLRR5 pKa = 11.84FTARR9 pKa = 11.84LCLQRR14 pKa = 11.84YY15 pKa = 9.74DD16 pKa = 4.0EE17 pKa = 5.1FVTLQSSRR25 pKa = 11.84EE26 pKa = 3.86QQGNIGNFKK35 pKa = 10.62EE36 pKa = 4.32KK37 pKa = 9.15LTHH40 pKa = 7.16FIGSRR45 pKa = 11.84LRR47 pKa = 11.84ILSLFSSFAVCLAQRR62 pKa = 3.89
Molecular weight: 7.21 kDa
Isoelectric point according different methods:
Peptides (in silico digests for buttom-up proteomics)
Below you can find in silico digests of the whole proteome with Trypsin, Chymotrypsin, Trypsin+LysC, LysN, ArgC proteases suitable for different mass spec machines.| Try ESI |
 |
|---|
| ChTry ESI |
|
|---|
| ArgC ESI |
|
|---|
| LysN ESI |
|
|---|
| TryLysC ESI |
|
|---|
| Try MALDI |
|
|---|
| ChTry MALDI |
|
|---|
| ArgC MALDI |
|
|---|
| LysN MALDI |
|
|---|
| TryLysC MALDI |
|
|---|
| Try LTQ |
|
|---|
| ChTry LTQ |
|
|---|
| ArgC LTQ |
|
|---|
| LysN LTQ |
|
|---|
| TryLysC LTQ |
|
|---|
| Try MSlow |
|
|---|
| ChTry MSlow |
|
|---|
| ArgC MSlow |
|
|---|
| LysN MSlow |
|
|---|
| TryLysC MSlow |
|
|---|
| Try MShigh |
|
|---|
| ChTry MShigh |
|
|---|
| ArgC MShigh |
|
|---|
| LysN MShigh |
|
|---|
| TryLysC MShigh |
|
|---|
General Statistics
Number of major isoforms |
Number of additional isoforms |
Number of all proteins |
Number of amino acids |
Min. Seq. Length |
Max. Seq. Length |
Avg. Seq. Length |
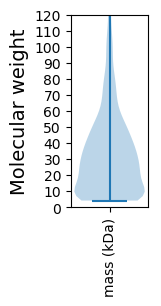
Avg. Mol. Weight |
|---|---|---|---|---|---|---|---|
0 |
734294 |
38 |
2495 |
317.1 |
35.61 |
Amino acid frequency
Ala |
Cys |
Asp |
Glu |
Phe |
Gly |
His |
Ile |
Lys |
Leu |
|---|---|---|---|---|---|---|---|---|---|
8.248 ± 0.052 | 1.119 ± 0.021 |
5.242 ± 0.036 | 6.192 ± 0.054 |
4.576 ± 0.036 | 6.629 ± 0.049 |
2.374 ± 0.03 | 5.795 ± 0.049 |
5.58 ± 0.047 | 9.759 ± 0.061 |
Met |
Asn |
Gln |
Pro |
Arg |
Ser |
Thr |
Val |
Trp |
Tyr |
|---|---|---|---|---|---|---|---|---|---|
2.487 ± 0.025 | 4.562 ± 0.048 |
3.98 ± 0.032 | 4.222 ± 0.033 |
5.358 ± 0.04 | 6.307 ± 0.044 |
5.792 ± 0.04 | 6.682 ± 0.044 |
1.244 ± 0.019 | 3.852 ± 0.036 |
Most of the basic statistics you can see at this page can be downloaded from this CSV file
See this proteome in:

Proteome-pI is available under Creative Commons Attribution-NoDerivs license, for more details see here
| Reference: Kozlowski LP. Proteome-pI 2.0: Proteome Isoelectric Point Database Update. Nucleic Acids Res. 2021, doi: 10.1093/nar/gkab944 | Contact: Lukasz P. Kozlowski |