Thiothrix eikelboomii
Taxonomy: cellular organisms; Bacteria; Proteobacteria; Gammaproteobacteria; Thiotrichales; Thiotrichaceae; Thiothrix
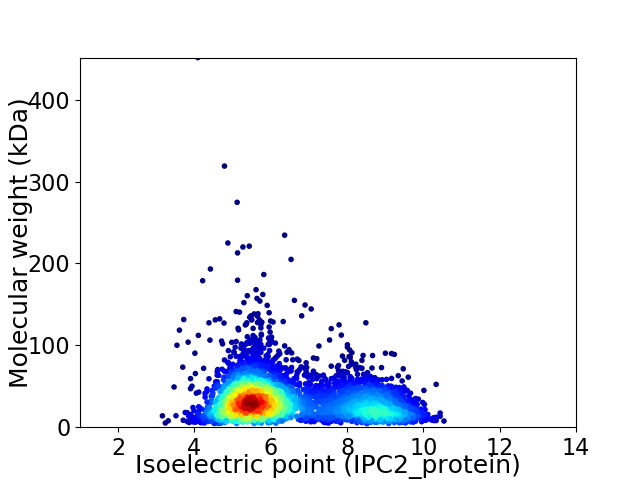
Average proteome isoelectric point is 6.45
Get precalculated fractions of proteins

Virtual 2D-PAGE plot for 3906 proteins (isoelectric point calculated using IPC2_protein)
Get csv file with sequences according to given criteria:
* You can choose from 21 different methods for calculating isoelectric point
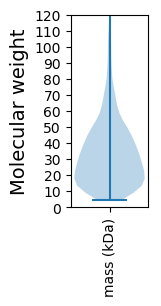
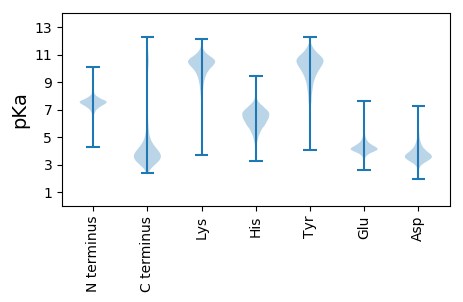
Summary statistics related to proteome-wise predictions


Protein with the lowest isoelectric point:
>tr|A0A1T4XKW8|A0A1T4XKW8_9GAMM Uncharacterized protein OS=Thiothrix eikelboomii OX=92487 GN=SAMN02745130_03104 PE=3 SV=1
MM1 pKa = 7.42SNVPANLKK9 pKa = 10.19YY10 pKa = 10.6ADD12 pKa = 3.61SHH14 pKa = 5.56EE15 pKa = 4.62WILDD19 pKa = 3.62HH20 pKa = 7.65GDD22 pKa = 3.31GTVTIGITDD31 pKa = 3.96HH32 pKa = 6.71AQALLGDD39 pKa = 4.35LVFVEE44 pKa = 4.81LPEE47 pKa = 5.3IGSILSAGDD56 pKa = 3.07EE57 pKa = 4.44CGVVEE62 pKa = 4.4SVKK65 pKa = 10.57AASDD69 pKa = 3.49IYY71 pKa = 11.25APIGGEE77 pKa = 3.91VFEE80 pKa = 5.1VNHH83 pKa = 6.31EE84 pKa = 4.26LDD86 pKa = 4.59DD87 pKa = 4.61SPEE90 pKa = 4.06LVNTDD95 pKa = 3.56PYY97 pKa = 9.23EE98 pKa = 4.33AGWIFKK104 pKa = 10.58LKK106 pKa = 10.76LEE108 pKa = 4.41NSSDD112 pKa = 3.56LAALLSADD120 pKa = 3.73AYY122 pKa = 10.28GEE124 pKa = 4.23LVASEE129 pKa = 4.21AA130 pKa = 4.02
MM1 pKa = 7.42SNVPANLKK9 pKa = 10.19YY10 pKa = 10.6ADD12 pKa = 3.61SHH14 pKa = 5.56EE15 pKa = 4.62WILDD19 pKa = 3.62HH20 pKa = 7.65GDD22 pKa = 3.31GTVTIGITDD31 pKa = 3.96HH32 pKa = 6.71AQALLGDD39 pKa = 4.35LVFVEE44 pKa = 4.81LPEE47 pKa = 5.3IGSILSAGDD56 pKa = 3.07EE57 pKa = 4.44CGVVEE62 pKa = 4.4SVKK65 pKa = 10.57AASDD69 pKa = 3.49IYY71 pKa = 11.25APIGGEE77 pKa = 3.91VFEE80 pKa = 5.1VNHH83 pKa = 6.31EE84 pKa = 4.26LDD86 pKa = 4.59DD87 pKa = 4.61SPEE90 pKa = 4.06LVNTDD95 pKa = 3.56PYY97 pKa = 9.23EE98 pKa = 4.33AGWIFKK104 pKa = 10.58LKK106 pKa = 10.76LEE108 pKa = 4.41NSSDD112 pKa = 3.56LAALLSADD120 pKa = 3.73AYY122 pKa = 10.28GEE124 pKa = 4.23LVASEE129 pKa = 4.21AA130 pKa = 4.02
Molecular weight: 13.77 kDa
Isoelectric point according different methods:
Protein with the highest isoelectric point:
>tr|A0A1T4VRE8|A0A1T4VRE8_9GAMM Transcriptional regulator TetR family OS=Thiothrix eikelboomii OX=92487 GN=SAMN02745130_00056 PE=4 SV=1
MM1 pKa = 7.71KK2 pKa = 10.1FQLLIEE8 pKa = 4.34EE9 pKa = 4.24QQGRR13 pKa = 11.84ILDD16 pKa = 3.79VATSAEE22 pKa = 4.12QEE24 pKa = 4.05HH25 pKa = 7.02DD26 pKa = 3.24LCLARR31 pKa = 11.84RR32 pKa = 11.84HH33 pKa = 5.43AHH35 pKa = 6.25HH36 pKa = 7.03LPAGSVCAVDD46 pKa = 3.8LGYY49 pKa = 11.23VGFRR53 pKa = 11.84VEE55 pKa = 4.21GCSVVMPFKK64 pKa = 10.89KK65 pKa = 10.13PLGRR69 pKa = 11.84DD70 pKa = 3.49LEE72 pKa = 4.43PEE74 pKa = 3.83QIEE77 pKa = 4.34FNQRR81 pKa = 11.84FAKK84 pKa = 10.28VRR86 pKa = 11.84VKK88 pKa = 10.46VEE90 pKa = 3.39HH91 pKa = 7.3RR92 pKa = 11.84IRR94 pKa = 11.84SLKK97 pKa = 9.89IFRR100 pKa = 11.84ILKK103 pKa = 8.51GVYY106 pKa = 8.79RR107 pKa = 11.84GRR109 pKa = 11.84RR110 pKa = 11.84QRR112 pKa = 11.84FGLRR116 pKa = 11.84LRR118 pKa = 11.84LIAALVNRR126 pKa = 11.84MIGGG130 pKa = 3.59
MM1 pKa = 7.71KK2 pKa = 10.1FQLLIEE8 pKa = 4.34EE9 pKa = 4.24QQGRR13 pKa = 11.84ILDD16 pKa = 3.79VATSAEE22 pKa = 4.12QEE24 pKa = 4.05HH25 pKa = 7.02DD26 pKa = 3.24LCLARR31 pKa = 11.84RR32 pKa = 11.84HH33 pKa = 5.43AHH35 pKa = 6.25HH36 pKa = 7.03LPAGSVCAVDD46 pKa = 3.8LGYY49 pKa = 11.23VGFRR53 pKa = 11.84VEE55 pKa = 4.21GCSVVMPFKK64 pKa = 10.89KK65 pKa = 10.13PLGRR69 pKa = 11.84DD70 pKa = 3.49LEE72 pKa = 4.43PEE74 pKa = 3.83QIEE77 pKa = 4.34FNQRR81 pKa = 11.84FAKK84 pKa = 10.28VRR86 pKa = 11.84VKK88 pKa = 10.46VEE90 pKa = 3.39HH91 pKa = 7.3RR92 pKa = 11.84IRR94 pKa = 11.84SLKK97 pKa = 9.89IFRR100 pKa = 11.84ILKK103 pKa = 8.51GVYY106 pKa = 8.79RR107 pKa = 11.84GRR109 pKa = 11.84RR110 pKa = 11.84QRR112 pKa = 11.84FGLRR116 pKa = 11.84LRR118 pKa = 11.84LIAALVNRR126 pKa = 11.84MIGGG130 pKa = 3.59
Molecular weight: 14.96 kDa
Isoelectric point according different methods:
Peptides (in silico digests for buttom-up proteomics)
Below you can find in silico digests of the whole proteome with Trypsin, Chymotrypsin, Trypsin+LysC, LysN, ArgC proteases suitable for different mass spec machines.| Try ESI |
 |
|---|
| ChTry ESI |
 |
|---|
| ArgC ESI |
 |
|---|
| LysN ESI |
 |
|---|
| TryLysC ESI |
 |
|---|
| Try MALDI |
 |
|---|
| ChTry MALDI |
 |
|---|
| ArgC MALDI |
 |
|---|
| LysN MALDI |
 |
|---|
| TryLysC MALDI |
 |
|---|
| Try LTQ |
 |
|---|
| ChTry LTQ |
 |
|---|
| ArgC LTQ |
 |
|---|
| LysN LTQ |
 |
|---|
| TryLysC LTQ |
 |
|---|
| Try MSlow |
 |
|---|
| ChTry MSlow |
 |
|---|
| ArgC MSlow |
 |
|---|
| LysN MSlow |
 |
|---|
| TryLysC MSlow |
 |
|---|
| Try MShigh |
 |
|---|
| ChTry MShigh |
 |
|---|
| ArgC MShigh |
 |
|---|
| LysN MShigh |
 |
|---|
| TryLysC MShigh |
 |
|---|
General Statistics
Number of major isoforms |
Number of additional isoforms |
Number of all proteins |
Number of amino acids |
Min. Seq. Length |
Max. Seq. Length |
Avg. Seq. Length |
Avg. Mol. Weight |
|---|---|---|---|---|---|---|---|
0 |
1248811 |
39 |
4364 |
319.7 |
35.39 |
Amino acid frequency
Ala |
Cys |
Asp |
Glu |
Phe |
Gly |
His |
Ile |
Lys |
Leu |
|---|---|---|---|---|---|---|---|---|---|
10.113 ± 0.05 | 0.954 ± 0.012 |
4.891 ± 0.032 | 5.825 ± 0.033 |
3.781 ± 0.027 | 6.97 ± 0.046 |
2.3 ± 0.021 | 5.566 ± 0.032 |
4.423 ± 0.037 | 11.481 ± 0.059 |
Met |
Asn |
Gln |
Pro |
Arg |
Ser |
Thr |
Val |
Trp |
Tyr |
|---|---|---|---|---|---|---|---|---|---|
2.369 ± 0.024 | 3.609 ± 0.03 |
4.605 ± 0.028 | 5.373 ± 0.037 |
5.251 ± 0.035 | 5.908 ± 0.035 |
5.571 ± 0.037 | 6.556 ± 0.035 |
1.419 ± 0.017 | 3.034 ± 0.022 |
Most of the basic statistics you can see at this page can be downloaded from this CSV file
Proteome-pI is available under Creative Commons Attribution-NoDerivs license, for more details see here
| Reference: Kozlowski LP. Proteome-pI 2.0: Proteome Isoelectric Point Database Update. Nucleic Acids Res. 2021, doi: 10.1093/nar/gkab944 | Contact: Lukasz P. Kozlowski |
