Bdellovibrio sp. NC01
Taxonomy: cellular organisms; Bacteria; Proteobacteria; Oligoflexia; Bdellovibrionales; Bdellovibrionaceae; Bdellovibrio; unclassified Bdellovibrio
Average proteome isoelectric point is 6.83
Get precalculated fractions of proteins

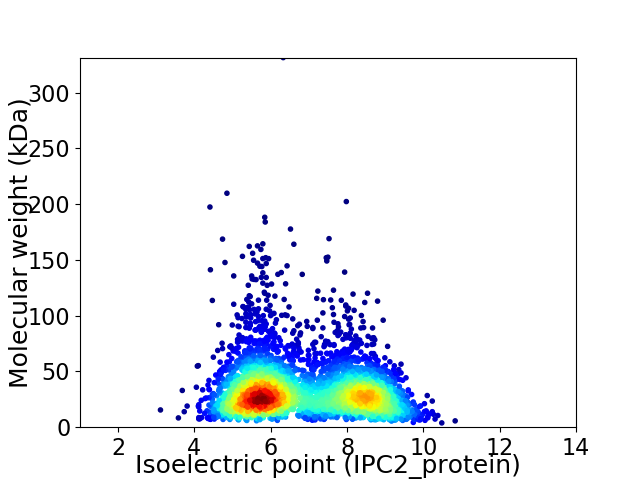
Virtual 2D-PAGE plot for 3773 proteins (isoelectric point calculated using IPC2_protein)
Get csv file with sequences according to given criteria:
* You can choose from 21 different methods for calculating isoelectric point
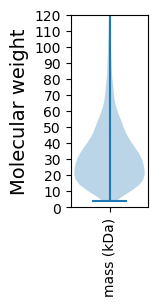
Summary statistics related to proteome-wise predictions


Protein with the lowest isoelectric point:
>tr|A0A514WT11|A0A514WT11_9PROT 1 4-dihydroxy-2-naphthoate octaprenyltransferase OS=Bdellovibrio sp. NC01 OX=2220073 GN=menA PE=3 SV=1
MM1 pKa = 7.5LACPSCQKK9 pKa = 10.3PVEE12 pKa = 4.29ILDD15 pKa = 3.65KK16 pKa = 11.15HH17 pKa = 6.67LGTLFTCPHH26 pKa = 6.71CGAVYY31 pKa = 9.85FIDD34 pKa = 5.35FNGQPEE40 pKa = 4.44MANHH44 pKa = 5.76EE45 pKa = 4.5AEE47 pKa = 4.48PDD49 pKa = 3.44EE50 pKa = 4.72TPAQSFEE57 pKa = 4.63TPVSEE62 pKa = 4.78QPADD66 pKa = 3.78FSDD69 pKa = 4.17GQDD72 pKa = 3.31FANQGSQDD80 pKa = 3.66FGQSPVATDD89 pKa = 5.05FSAEE93 pKa = 4.19TNYY96 pKa = 9.6STDD99 pKa = 3.9QNFQQQGDD107 pKa = 4.0FQSQDD112 pKa = 2.76GFQQNGFEE120 pKa = 4.27QNNVEE125 pKa = 4.18QSADD129 pKa = 3.56QFGSPASVYY138 pKa = 11.0NNDD141 pKa = 2.94SHH143 pKa = 7.32GVGGQAVEE151 pKa = 4.06QNFGGEE157 pKa = 3.8QSYY160 pKa = 11.03QDD162 pKa = 3.7SSAEE166 pKa = 4.09YY167 pKa = 10.5ADD169 pKa = 4.72SADD172 pKa = 3.43QEE174 pKa = 4.59APVAEE179 pKa = 4.61APVEE183 pKa = 3.89EE184 pKa = 5.09APFDD188 pKa = 4.26FNATLDD194 pKa = 4.01QQPMQAPPPACVSDD208 pKa = 3.6SADD211 pKa = 3.49FSDD214 pKa = 3.93VTDD217 pKa = 4.5FANADD222 pKa = 3.66TTAGPLTYY230 pKa = 10.62VVIIDD235 pKa = 5.05GIEE238 pKa = 3.99SSQLLYY244 pKa = 10.34QLKK247 pKa = 9.98EE248 pKa = 3.75AMTDD252 pKa = 3.52SRR254 pKa = 11.84FGWDD258 pKa = 3.24VNEE261 pKa = 5.4LLTQVGGGRR270 pKa = 11.84LVIPGLNPAKK280 pKa = 10.44ASVLIGRR287 pKa = 11.84IKK289 pKa = 10.52YY290 pKa = 10.47LPFKK294 pKa = 10.54ISWRR298 pKa = 11.84QDD300 pKa = 3.29VLSGSS305 pKa = 3.67
MM1 pKa = 7.5LACPSCQKK9 pKa = 10.3PVEE12 pKa = 4.29ILDD15 pKa = 3.65KK16 pKa = 11.15HH17 pKa = 6.67LGTLFTCPHH26 pKa = 6.71CGAVYY31 pKa = 9.85FIDD34 pKa = 5.35FNGQPEE40 pKa = 4.44MANHH44 pKa = 5.76EE45 pKa = 4.5AEE47 pKa = 4.48PDD49 pKa = 3.44EE50 pKa = 4.72TPAQSFEE57 pKa = 4.63TPVSEE62 pKa = 4.78QPADD66 pKa = 3.78FSDD69 pKa = 4.17GQDD72 pKa = 3.31FANQGSQDD80 pKa = 3.66FGQSPVATDD89 pKa = 5.05FSAEE93 pKa = 4.19TNYY96 pKa = 9.6STDD99 pKa = 3.9QNFQQQGDD107 pKa = 4.0FQSQDD112 pKa = 2.76GFQQNGFEE120 pKa = 4.27QNNVEE125 pKa = 4.18QSADD129 pKa = 3.56QFGSPASVYY138 pKa = 11.0NNDD141 pKa = 2.94SHH143 pKa = 7.32GVGGQAVEE151 pKa = 4.06QNFGGEE157 pKa = 3.8QSYY160 pKa = 11.03QDD162 pKa = 3.7SSAEE166 pKa = 4.09YY167 pKa = 10.5ADD169 pKa = 4.72SADD172 pKa = 3.43QEE174 pKa = 4.59APVAEE179 pKa = 4.61APVEE183 pKa = 3.89EE184 pKa = 5.09APFDD188 pKa = 4.26FNATLDD194 pKa = 4.01QQPMQAPPPACVSDD208 pKa = 3.6SADD211 pKa = 3.49FSDD214 pKa = 3.93VTDD217 pKa = 4.5FANADD222 pKa = 3.66TTAGPLTYY230 pKa = 10.62VVIIDD235 pKa = 5.05GIEE238 pKa = 3.99SSQLLYY244 pKa = 10.34QLKK247 pKa = 9.98EE248 pKa = 3.75AMTDD252 pKa = 3.52SRR254 pKa = 11.84FGWDD258 pKa = 3.24VNEE261 pKa = 5.4LLTQVGGGRR270 pKa = 11.84LVIPGLNPAKK280 pKa = 10.44ASVLIGRR287 pKa = 11.84IKK289 pKa = 10.52YY290 pKa = 10.47LPFKK294 pKa = 10.54ISWRR298 pKa = 11.84QDD300 pKa = 3.29VLSGSS305 pKa = 3.67
Molecular weight: 32.94 kDa
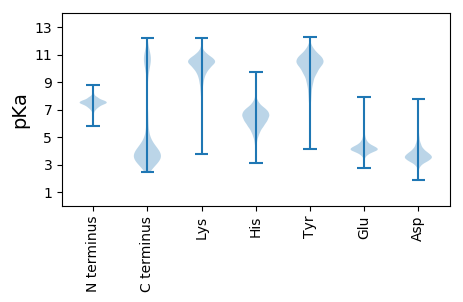
Isoelectric point according different methods:
Protein with the highest isoelectric point:
>tr|A0A514WZ62|A0A514WZ62_9PROT 50S ribosomal protein L2 OS=Bdellovibrio sp. NC01 OX=2220073 GN=rplB PE=3 SV=1
MM1 pKa = 7.41NSSPADD7 pKa = 3.5KK8 pKa = 10.69NRR10 pKa = 11.84QLTAKK15 pKa = 9.86KK16 pKa = 10.04PSNTHH21 pKa = 3.79QNGRR25 pKa = 11.84FFYY28 pKa = 10.5CFRR31 pKa = 11.84ALFSGFFMPLRR42 pKa = 11.84YY43 pKa = 9.74GFQRR47 pKa = 11.84EE48 pKa = 4.3TTVFWAAFLEE58 pKa = 4.52LGFSHH63 pKa = 6.29IQFYY67 pKa = 11.01AKK69 pKa = 9.96QRR71 pKa = 11.84WGFGLDD77 pKa = 3.11LTPCVRR83 pKa = 11.84VKK85 pKa = 10.63LSKK88 pKa = 10.84SFIKK92 pKa = 10.22NWPGRR97 pKa = 11.84QISAAPVRR105 pKa = 11.84EE106 pKa = 4.02QGQEE110 pKa = 3.58PSIKK114 pKa = 9.84IRR116 pKa = 3.48
MM1 pKa = 7.41NSSPADD7 pKa = 3.5KK8 pKa = 10.69NRR10 pKa = 11.84QLTAKK15 pKa = 9.86KK16 pKa = 10.04PSNTHH21 pKa = 3.79QNGRR25 pKa = 11.84FFYY28 pKa = 10.5CFRR31 pKa = 11.84ALFSGFFMPLRR42 pKa = 11.84YY43 pKa = 9.74GFQRR47 pKa = 11.84EE48 pKa = 4.3TTVFWAAFLEE58 pKa = 4.52LGFSHH63 pKa = 6.29IQFYY67 pKa = 11.01AKK69 pKa = 9.96QRR71 pKa = 11.84WGFGLDD77 pKa = 3.11LTPCVRR83 pKa = 11.84VKK85 pKa = 10.63LSKK88 pKa = 10.84SFIKK92 pKa = 10.22NWPGRR97 pKa = 11.84QISAAPVRR105 pKa = 11.84EE106 pKa = 4.02QGQEE110 pKa = 3.58PSIKK114 pKa = 9.84IRR116 pKa = 3.48
Molecular weight: 13.51 kDa
Isoelectric point according different methods:
Peptides (in silico digests for buttom-up proteomics)
Below you can find in silico digests of the whole proteome with Trypsin, Chymotrypsin, Trypsin+LysC, LysN, ArgC proteases suitable for different mass spec machines.| Try ESI |
 |
|---|
| ChTry ESI |
 |
|---|
| ArgC ESI |
 |
|---|
| LysN ESI |
 |
|---|
| TryLysC ESI |
 |
|---|
| Try MALDI |
 |
|---|
| ChTry MALDI |
 |
|---|
| ArgC MALDI |
 |
|---|
| LysN MALDI |
 |
|---|
| TryLysC MALDI |
 |
|---|
| Try LTQ |
 |
|---|
| ChTry LTQ |
 |
|---|
| ArgC LTQ |
 |
|---|
| LysN LTQ |
 |
|---|
| TryLysC LTQ |
 |
|---|
| Try MSlow |
 |
|---|
| ChTry MSlow |
 |
|---|
| ArgC MSlow |
 |
|---|
| LysN MSlow |
 |
|---|
| TryLysC MSlow |
 |
|---|
| Try MShigh |
 |
|---|
| ChTry MShigh |
 |
|---|
| ArgC MShigh |
 |
|---|
| LysN MShigh |
 |
|---|
| TryLysC MShigh |
 |
|---|
General Statistics
Number of major isoforms |
Number of additional isoforms |
Number of all proteins |
Number of amino acids |
Min. Seq. Length |
Max. Seq. Length |
Avg. Seq. Length |
Avg. Mol. Weight |
|---|---|---|---|---|---|---|---|
0 |
1203359 |
36 |
2902 |
318.9 |
35.4 |
Amino acid frequency
Ala |
Cys |
Asp |
Glu |
Phe |
Gly |
His |
Ile |
Lys |
Leu |
|---|---|---|---|---|---|---|---|---|---|
8.553 ± 0.048 | 0.931 ± 0.013 |
5.169 ± 0.026 | 6.143 ± 0.054 |
4.603 ± 0.031 | 7.012 ± 0.048 |
1.879 ± 0.018 | 5.948 ± 0.031 |
6.897 ± 0.05 | 9.521 ± 0.046 |
Met |
Asn |
Gln |
Pro |
Arg |
Ser |
Thr |
Val |
Trp |
Tyr |
|---|---|---|---|---|---|---|---|---|---|
2.614 ± 0.023 | 4.397 ± 0.033 |
4.036 ± 0.027 | 3.955 ± 0.027 |
4.371 ± 0.03 | 7.028 ± 0.052 |
5.725 ± 0.061 | 6.916 ± 0.031 |
1.186 ± 0.014 | 3.116 ± 0.02 |
Most of the basic statistics you can see at this page can be downloaded from this CSV file
Proteome-pI is available under Creative Commons Attribution-NoDerivs license, for more details see here
| Reference: Kozlowski LP. Proteome-pI 2.0: Proteome Isoelectric Point Database Update. Nucleic Acids Res. 2021, doi: 10.1093/nar/gkab944 | Contact: Lukasz P. Kozlowski |
