Ruminococcus flavefaciens
Taxonomy: cellular organisms; Bacteria; Terrabacteria group; Firmicutes; Clostridia; Eubacteriales; Oscillospiraceae; Ruminococcus
Average proteome isoelectric point is 5.89
Get precalculated fractions of proteins

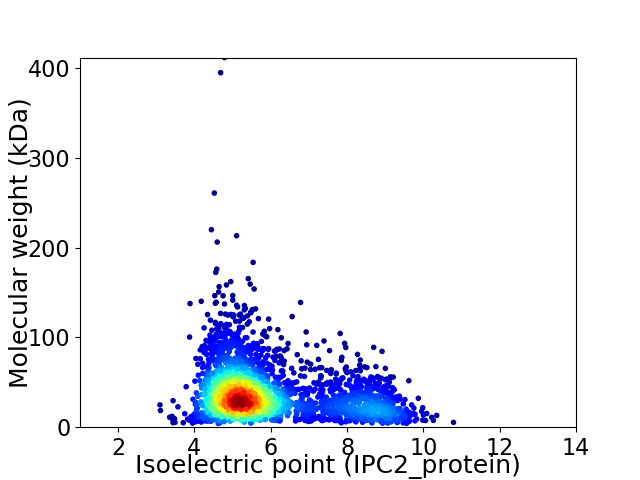
Virtual 2D-PAGE plot for 2780 proteins (isoelectric point calculated using IPC2_protein)
Get csv file with sequences according to given criteria:
* You can choose from 21 different methods for calculating isoelectric point
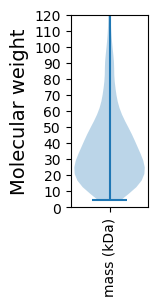
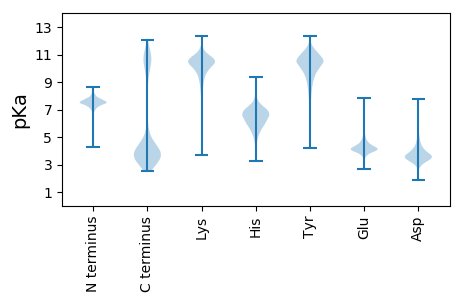
Summary statistics related to proteome-wise predictions


Protein with the lowest isoelectric point:
>tr|A0A1K1NZF6|A0A1K1NZF6_RUMFL Acyl carrier protein OS=Ruminococcus flavefaciens OX=1265 GN=SAMN02910280_2291 PE=4 SV=1
MM1 pKa = 7.14IQLPIYY7 pKa = 10.41EE8 pKa = 4.98EE9 pKa = 3.98FAHH12 pKa = 6.51WLDD15 pKa = 6.0DD16 pKa = 3.4ILEE19 pKa = 4.35NNEE22 pKa = 3.87MPEE25 pKa = 3.98EE26 pKa = 4.03TKK28 pKa = 10.8AFCFNLYY35 pKa = 10.1EE36 pKa = 4.37EE37 pKa = 4.74SDD39 pKa = 3.71EE40 pKa = 4.02EE41 pKa = 4.77HH42 pKa = 6.44ICGVQIIAAGEE53 pKa = 3.9YY54 pKa = 10.59DD55 pKa = 4.23PEE57 pKa = 6.17DD58 pKa = 4.43KK59 pKa = 10.98DD60 pKa = 5.22GEE62 pKa = 4.49WACEE66 pKa = 4.0EE67 pKa = 4.23VWSSEE72 pKa = 3.9EE73 pKa = 4.2NIFTVDD79 pKa = 3.12TSDD82 pKa = 4.91EE83 pKa = 4.33EE84 pKa = 4.39DD85 pKa = 3.68TSWAHH90 pKa = 5.02AQEE93 pKa = 5.02LIKK96 pKa = 10.85EE97 pKa = 4.26MIEE100 pKa = 3.83EE101 pKa = 4.01YY102 pKa = 10.69LRR104 pKa = 11.84NGKK107 pKa = 9.99YY108 pKa = 10.21SGILSGAAAVAVGFVDD124 pKa = 4.43GEE126 pKa = 4.26LDD128 pKa = 4.46IISQQ132 pKa = 3.57
MM1 pKa = 7.14IQLPIYY7 pKa = 10.41EE8 pKa = 4.98EE9 pKa = 3.98FAHH12 pKa = 6.51WLDD15 pKa = 6.0DD16 pKa = 3.4ILEE19 pKa = 4.35NNEE22 pKa = 3.87MPEE25 pKa = 3.98EE26 pKa = 4.03TKK28 pKa = 10.8AFCFNLYY35 pKa = 10.1EE36 pKa = 4.37EE37 pKa = 4.74SDD39 pKa = 3.71EE40 pKa = 4.02EE41 pKa = 4.77HH42 pKa = 6.44ICGVQIIAAGEE53 pKa = 3.9YY54 pKa = 10.59DD55 pKa = 4.23PEE57 pKa = 6.17DD58 pKa = 4.43KK59 pKa = 10.98DD60 pKa = 5.22GEE62 pKa = 4.49WACEE66 pKa = 4.0EE67 pKa = 4.23VWSSEE72 pKa = 3.9EE73 pKa = 4.2NIFTVDD79 pKa = 3.12TSDD82 pKa = 4.91EE83 pKa = 4.33EE84 pKa = 4.39DD85 pKa = 3.68TSWAHH90 pKa = 5.02AQEE93 pKa = 5.02LIKK96 pKa = 10.85EE97 pKa = 4.26MIEE100 pKa = 3.83EE101 pKa = 4.01YY102 pKa = 10.69LRR104 pKa = 11.84NGKK107 pKa = 9.99YY108 pKa = 10.21SGILSGAAAVAVGFVDD124 pKa = 4.43GEE126 pKa = 4.26LDD128 pKa = 4.46IISQQ132 pKa = 3.57
Molecular weight: 15.03 kDa
Isoelectric point according different methods:
Protein with the highest isoelectric point:
>tr|A0A1K1N6L4|A0A1K1N6L4_RUMFL Leader peptidase (Prepilin peptidase) / N-methyltransferase OS=Ruminococcus flavefaciens OX=1265 GN=SAMN02910280_1770 PE=3 SV=1
MM1 pKa = 7.66SKK3 pKa = 10.53RR4 pKa = 11.84LRR6 pKa = 11.84IAIAAGAPLLVLIAFVLRR24 pKa = 11.84DD25 pKa = 3.63QIVGFARR32 pKa = 11.84LMPPCSFHH40 pKa = 7.4KK41 pKa = 10.27LTGYY45 pKa = 9.11WCTGCGNTRR54 pKa = 11.84STIALLQGHH63 pKa = 7.2IWTAIRR69 pKa = 11.84NNATMPFLSLLLCLLYY85 pKa = 10.28IEE87 pKa = 4.85NFAAIFGRR95 pKa = 11.84DD96 pKa = 3.13IKK98 pKa = 11.01LLPRR102 pKa = 11.84KK103 pKa = 9.47LWIWLIVIGLFVVYY117 pKa = 8.97YY118 pKa = 9.52IVRR121 pKa = 11.84NFIPALAPISS131 pKa = 3.7
MM1 pKa = 7.66SKK3 pKa = 10.53RR4 pKa = 11.84LRR6 pKa = 11.84IAIAAGAPLLVLIAFVLRR24 pKa = 11.84DD25 pKa = 3.63QIVGFARR32 pKa = 11.84LMPPCSFHH40 pKa = 7.4KK41 pKa = 10.27LTGYY45 pKa = 9.11WCTGCGNTRR54 pKa = 11.84STIALLQGHH63 pKa = 7.2IWTAIRR69 pKa = 11.84NNATMPFLSLLLCLLYY85 pKa = 10.28IEE87 pKa = 4.85NFAAIFGRR95 pKa = 11.84DD96 pKa = 3.13IKK98 pKa = 11.01LLPRR102 pKa = 11.84KK103 pKa = 9.47LWIWLIVIGLFVVYY117 pKa = 8.97YY118 pKa = 9.52IVRR121 pKa = 11.84NFIPALAPISS131 pKa = 3.7
Molecular weight: 14.76 kDa
Isoelectric point according different methods:
Peptides (in silico digests for buttom-up proteomics)
Below you can find in silico digests of the whole proteome with Trypsin, Chymotrypsin, Trypsin+LysC, LysN, ArgC proteases suitable for different mass spec machines.| Try ESI |
 |
|---|
| ChTry ESI |
 |
|---|
| ArgC ESI |
 |
|---|
| LysN ESI |
 |
|---|
| TryLysC ESI |
 |
|---|
| Try MALDI |
 |
|---|
| ChTry MALDI |
 |
|---|
| ArgC MALDI |
 |
|---|
| LysN MALDI |
 |
|---|
| TryLysC MALDI |
 |
|---|
| Try LTQ |
 |
|---|
| ChTry LTQ |
 |
|---|
| ArgC LTQ |
 |
|---|
| LysN LTQ |
 |
|---|
| TryLysC LTQ |
 |
|---|
| Try MSlow |
 |
|---|
| ChTry MSlow |
 |
|---|
| ArgC MSlow |
 |
|---|
| LysN MSlow |
 |
|---|
| TryLysC MSlow |
 |
|---|
| Try MShigh |
 |
|---|
| ChTry MShigh |
 |
|---|
| ArgC MShigh |
 |
|---|
| LysN MShigh |
 |
|---|
| TryLysC MShigh |
 |
|---|
General Statistics
Number of major isoforms |
Number of additional isoforms |
Number of all proteins |
Number of amino acids |
Min. Seq. Length |
Max. Seq. Length |
Avg. Seq. Length |
Avg. Mol. Weight |
|---|---|---|---|---|---|---|---|
0 |
979500 |
37 |
3739 |
352.3 |
39.28 |
Amino acid frequency
Ala |
Cys |
Asp |
Glu |
Phe |
Gly |
His |
Ile |
Lys |
Leu |
|---|---|---|---|---|---|---|---|---|---|
7.894 ± 0.05 | 1.643 ± 0.019 |
6.42 ± 0.037 | 7.033 ± 0.047 |
4.308 ± 0.037 | 7.064 ± 0.054 |
1.584 ± 0.019 | 7.327 ± 0.047 |
7.024 ± 0.04 | 8.091 ± 0.052 |
Met |
Asn |
Gln |
Pro |
Arg |
Ser |
Thr |
Val |
Trp |
Tyr |
|---|---|---|---|---|---|---|---|---|---|
2.806 ± 0.024 | 4.803 ± 0.041 |
3.28 ± 0.027 | 2.526 ± 0.032 |
4.051 ± 0.038 | 6.56 ± 0.042 |
5.943 ± 0.063 | 6.519 ± 0.036 |
0.88 ± 0.016 | 4.244 ± 0.038 |
Most of the basic statistics you can see at this page can be downloaded from this CSV file
Proteome-pI is available under Creative Commons Attribution-NoDerivs license, for more details see here
| Reference: Kozlowski LP. Proteome-pI 2.0: Proteome Isoelectric Point Database Update. Nucleic Acids Res. 2021, doi: 10.1093/nar/gkab944 | Contact: Lukasz P. Kozlowski |
