archaeon HR03
Taxonomy: cellular organisms; Archaea; unclassified Archaea
Average proteome isoelectric point is 7.0
Get precalculated fractions of proteins
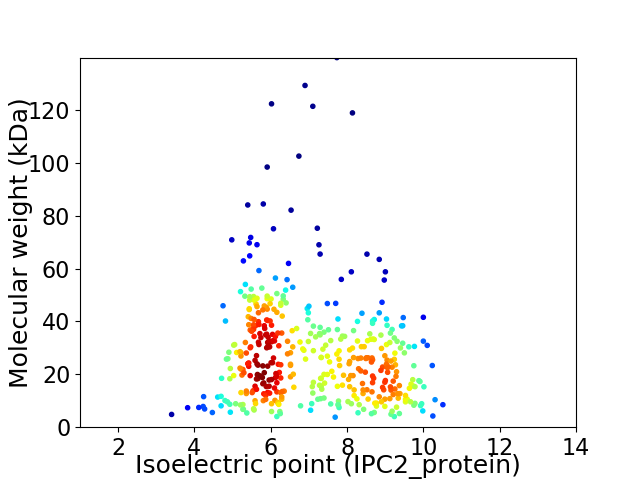
Virtual 2D-PAGE plot for 434 proteins (isoelectric point calculated using IPC2_protein)
Get csv file with sequences according to given criteria:
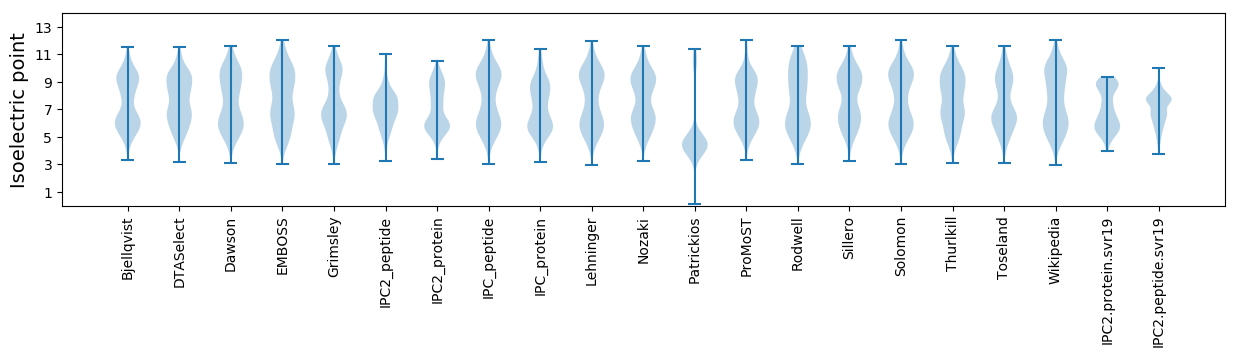
* You can choose from 21 different methods for calculating isoelectric point
Summary statistics related to proteome-wise predictions
Protein with the lowest isoelectric point:
>tr|A0A2H5V6V6|A0A2H5V6V6_9ARCH Isopentenyl phosphate kinase OS=archaeon HR03 OX=2035439 GN=argB PE=3 SV=1
MM1 pKa = 7.4VSPDD5 pKa = 3.41YY6 pKa = 10.93FFAEE10 pKa = 4.16IFGMCCEE17 pKa = 4.03QFADD21 pKa = 4.01DD22 pKa = 4.31VEE24 pKa = 4.71VDD26 pKa = 3.73VFPLGVPHH34 pKa = 7.45RR35 pKa = 11.84FLASQCDD42 pKa = 3.53PALVNLFNLVITLYY56 pKa = 9.6QRR58 pKa = 11.84RR59 pKa = 11.84II60 pKa = 3.47
MM1 pKa = 7.4VSPDD5 pKa = 3.41YY6 pKa = 10.93FFAEE10 pKa = 4.16IFGMCCEE17 pKa = 4.03QFADD21 pKa = 4.01DD22 pKa = 4.31VEE24 pKa = 4.71VDD26 pKa = 3.73VFPLGVPHH34 pKa = 7.45RR35 pKa = 11.84FLASQCDD42 pKa = 3.53PALVNLFNLVITLYY56 pKa = 9.6QRR58 pKa = 11.84RR59 pKa = 11.84II60 pKa = 3.47
Molecular weight: 6.9 kDa
Isoelectric point according different methods:
Protein with the highest isoelectric point:
>tr|A0A2H5V6H6|A0A2H5V6H6_9ARCH Leucine-responsive regulatory protein OS=archaeon HR03 OX=2035439 GN=lrp PE=4 SV=1
MM1 pKa = 7.79AMVPMLKK8 pKa = 10.23NITSAAISNVVKK20 pKa = 10.67KK21 pKa = 10.25VANLLRR27 pKa = 11.84VRR29 pKa = 11.84RR30 pKa = 11.84YY31 pKa = 10.69AMRR34 pKa = 11.84GMSATAAEE42 pKa = 4.42EE43 pKa = 3.82RR44 pKa = 11.84RR45 pKa = 11.84EE46 pKa = 4.46GISRR50 pKa = 11.84QPTGLSPKK58 pKa = 9.6TSIEE62 pKa = 3.74AAISSFEE69 pKa = 4.22RR70 pKa = 11.84GGCSWFTDD78 pKa = 3.43SPLNSFLTAGTT89 pKa = 3.72
MM1 pKa = 7.79AMVPMLKK8 pKa = 10.23NITSAAISNVVKK20 pKa = 10.67KK21 pKa = 10.25VANLLRR27 pKa = 11.84VRR29 pKa = 11.84RR30 pKa = 11.84YY31 pKa = 10.69AMRR34 pKa = 11.84GMSATAAEE42 pKa = 4.42EE43 pKa = 3.82RR44 pKa = 11.84RR45 pKa = 11.84EE46 pKa = 4.46GISRR50 pKa = 11.84QPTGLSPKK58 pKa = 9.6TSIEE62 pKa = 3.74AAISSFEE69 pKa = 4.22RR70 pKa = 11.84GGCSWFTDD78 pKa = 3.43SPLNSFLTAGTT89 pKa = 3.72
Molecular weight: 9.59 kDa
Isoelectric point according different methods:
Peptides (in silico digests for buttom-up proteomics)
Below you can find in silico digests of the whole proteome with Trypsin, Chymotrypsin, Trypsin+LysC, LysN, ArgC proteases suitable for different mass spec machines.| Try ESI |
 |
|---|
| ChTry ESI |
|
|---|
| ArgC ESI |
|
|---|
| LysN ESI |
|
|---|
| TryLysC ESI |
|
|---|
| Try MALDI |
|
|---|
| ChTry MALDI |
|
|---|
| ArgC MALDI |
|
|---|
| LysN MALDI |
|
|---|
| TryLysC MALDI |
|
|---|
| Try LTQ |
|
|---|
| ChTry LTQ |
|
|---|
| ArgC LTQ |
|
|---|
| LysN LTQ |
|
|---|
| TryLysC LTQ |
|
|---|
| Try MSlow |
|
|---|
| ChTry MSlow |
|
|---|
| ArgC MSlow |
|
|---|
| LysN MSlow |
|
|---|
| TryLysC MSlow |
|
|---|
| Try MShigh |
|
|---|
| ChTry MShigh |
|
|---|
| ArgC MShigh |
|
|---|
| LysN MShigh |
|
|---|
| TryLysC MShigh |
|
|---|
General Statistics
Number of major isoforms |
Number of additional isoforms |
Number of all proteins |
Number of amino acids |
Min. Seq. Length |
Max. Seq. Length |
Avg. Seq. Length |
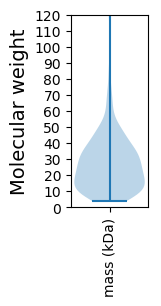
Avg. Mol. Weight |
|---|---|---|---|---|---|---|---|
0 |
110130 |
32 |
1254 |
253.8 |
28.2 |
Amino acid frequency
Ala |
Cys |
Asp |
Glu |
Phe |
Gly |
His |
Ile |
Lys |
Leu |
|---|---|---|---|---|---|---|---|---|---|
8.446 ± 0.117 | 0.872 ± 0.047 |
4.449 ± 0.077 | 7.212 ± 0.125 |
4.023 ± 0.087 | 7.625 ± 0.104 |
1.802 ± 0.056 | 5.93 ± 0.1 |
5.526 ± 0.107 | 10.54 ± 0.139 |
Met |
Asn |
Gln |
Pro |
Arg |
Ser |
Thr |
Val |
Trp |
Tyr |
|---|---|---|---|---|---|---|---|---|---|
2.558 ± 0.056 | 2.956 ± 0.066 |
4.695 ± 0.063 | 2.415 ± 0.051 |
6.361 ± 0.098 | 5.727 ± 0.098 |
5.094 ± 0.08 | 9.231 ± 0.115 |
1.124 ± 0.057 | 3.413 ± 0.064 |
Most of the basic statistics you can see at this page can be downloaded from this CSV file
See this proteome in:

Proteome-pI is available under Creative Commons Attribution-NoDerivs license, for more details see here
| Reference: Kozlowski LP. Proteome-pI 2.0: Proteome Isoelectric Point Database Update. Nucleic Acids Res. 2021, doi: 10.1093/nar/gkab944 | Contact: Lukasz P. Kozlowski |