Proteiniphilum saccharofermentans
Taxonomy: cellular organisms; Bacteria; FCB group; Bacteroidetes/Chlorobi group; Bacteroidetes; Bacteroidia; Bacteroidales; Dysgonomonadaceae; Proteiniphilum
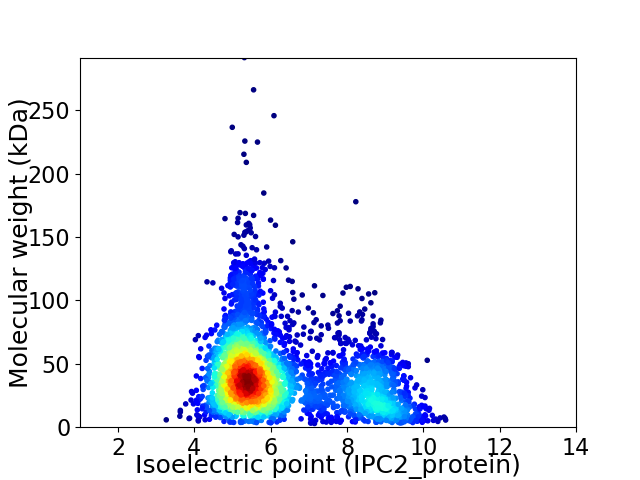
Average proteome isoelectric point is 6.25
Get precalculated fractions of proteins

Virtual 2D-PAGE plot for 3381 proteins (isoelectric point calculated using IPC2_protein)
Get csv file with sequences according to given criteria:
* You can choose from 21 different methods for calculating isoelectric point
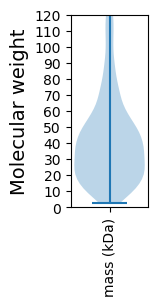
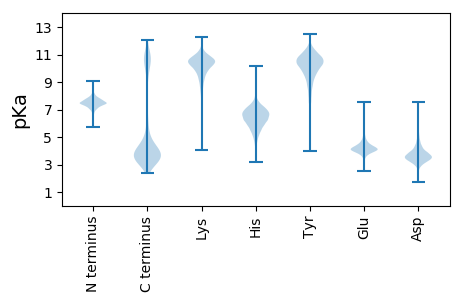
Summary statistics related to proteome-wise predictions


Protein with the lowest isoelectric point:
>tr|A0A1R3T542|A0A1R3T542_9BACT Uncharacterized protein OS=Proteiniphilum saccharofermentans OX=1642647 GN=PSM36_2511 PE=4 SV=1
MM1 pKa = 7.38MGTFYY6 pKa = 10.87RR7 pKa = 11.84KK8 pKa = 9.73IMFLDD13 pKa = 3.61DD14 pKa = 3.71AMIVRR19 pKa = 11.84PVTAEE24 pKa = 4.15DD25 pKa = 3.47IKK27 pKa = 10.47WANNEE32 pKa = 4.36LEE34 pKa = 4.13NSNLPLIPTGYY45 pKa = 11.31ADD47 pKa = 5.4FLKK50 pKa = 10.33HH51 pKa = 6.05CNGVAFNGVEE61 pKa = 4.16LYY63 pKa = 9.46GTDD66 pKa = 3.78IVTDD70 pKa = 3.72PQTNFKK76 pKa = 10.77LIDD79 pKa = 3.23IVSFSEE85 pKa = 4.0QQLEE89 pKa = 4.29LFNDD93 pKa = 3.14QLLYY97 pKa = 10.44FGRR100 pKa = 11.84VDD102 pKa = 4.89DD103 pKa = 7.01DD104 pKa = 3.75IFTFNPAVEE113 pKa = 4.36KK114 pKa = 11.39YY115 pKa = 6.27EE116 pKa = 4.09TRR118 pKa = 11.84DD119 pKa = 3.11ITSFEE124 pKa = 3.37IWNEE128 pKa = 3.79YY129 pKa = 10.89NSFEE133 pKa = 4.07EE134 pKa = 4.32FLEE137 pKa = 4.27KK138 pKa = 10.42EE139 pKa = 3.89ISEE142 pKa = 4.46KK143 pKa = 10.87YY144 pKa = 10.71LPTEE148 pKa = 3.89EE149 pKa = 4.81NEE151 pKa = 4.63VISSMVYY158 pKa = 10.54SRR160 pKa = 11.84MKK162 pKa = 10.05EE163 pKa = 3.84DD164 pKa = 3.56PVFAKK169 pKa = 10.82NILEE173 pKa = 4.4YY174 pKa = 8.61YY175 pKa = 10.35TLMADD180 pKa = 3.5SGNAEE185 pKa = 4.03AQYY188 pKa = 10.86QLAMLLMYY196 pKa = 10.4EE197 pKa = 4.35GGVVEE202 pKa = 4.33QDD204 pKa = 2.97YY205 pKa = 9.09DD206 pKa = 4.0TGFDD210 pKa = 3.15WLARR214 pKa = 11.84AAEE217 pKa = 3.98QGYY220 pKa = 7.9PQAGLLYY227 pKa = 10.6LEE229 pKa = 4.77EE230 pKa = 4.64TSTDD234 pKa = 3.22DD235 pKa = 5.07DD236 pKa = 3.57GRR238 pKa = 11.84YY239 pKa = 9.52DD240 pKa = 3.02AWVV243 pKa = 3.0
MM1 pKa = 7.38MGTFYY6 pKa = 10.87RR7 pKa = 11.84KK8 pKa = 9.73IMFLDD13 pKa = 3.61DD14 pKa = 3.71AMIVRR19 pKa = 11.84PVTAEE24 pKa = 4.15DD25 pKa = 3.47IKK27 pKa = 10.47WANNEE32 pKa = 4.36LEE34 pKa = 4.13NSNLPLIPTGYY45 pKa = 11.31ADD47 pKa = 5.4FLKK50 pKa = 10.33HH51 pKa = 6.05CNGVAFNGVEE61 pKa = 4.16LYY63 pKa = 9.46GTDD66 pKa = 3.78IVTDD70 pKa = 3.72PQTNFKK76 pKa = 10.77LIDD79 pKa = 3.23IVSFSEE85 pKa = 4.0QQLEE89 pKa = 4.29LFNDD93 pKa = 3.14QLLYY97 pKa = 10.44FGRR100 pKa = 11.84VDD102 pKa = 4.89DD103 pKa = 7.01DD104 pKa = 3.75IFTFNPAVEE113 pKa = 4.36KK114 pKa = 11.39YY115 pKa = 6.27EE116 pKa = 4.09TRR118 pKa = 11.84DD119 pKa = 3.11ITSFEE124 pKa = 3.37IWNEE128 pKa = 3.79YY129 pKa = 10.89NSFEE133 pKa = 4.07EE134 pKa = 4.32FLEE137 pKa = 4.27KK138 pKa = 10.42EE139 pKa = 3.89ISEE142 pKa = 4.46KK143 pKa = 10.87YY144 pKa = 10.71LPTEE148 pKa = 3.89EE149 pKa = 4.81NEE151 pKa = 4.63VISSMVYY158 pKa = 10.54SRR160 pKa = 11.84MKK162 pKa = 10.05EE163 pKa = 3.84DD164 pKa = 3.56PVFAKK169 pKa = 10.82NILEE173 pKa = 4.4YY174 pKa = 8.61YY175 pKa = 10.35TLMADD180 pKa = 3.5SGNAEE185 pKa = 4.03AQYY188 pKa = 10.86QLAMLLMYY196 pKa = 10.4EE197 pKa = 4.35GGVVEE202 pKa = 4.33QDD204 pKa = 2.97YY205 pKa = 9.09DD206 pKa = 4.0TGFDD210 pKa = 3.15WLARR214 pKa = 11.84AAEE217 pKa = 3.98QGYY220 pKa = 7.9PQAGLLYY227 pKa = 10.6LEE229 pKa = 4.77EE230 pKa = 4.64TSTDD234 pKa = 3.22DD235 pKa = 5.07DD236 pKa = 3.57GRR238 pKa = 11.84YY239 pKa = 9.52DD240 pKa = 3.02AWVV243 pKa = 3.0
Molecular weight: 28.15 kDa
Isoelectric point according different methods:
Protein with the highest isoelectric point:
>tr|A0A1R3TC74|A0A1R3TC74_9BACT Putative rhamnogalacturonyl hydrolase OS=Proteiniphilum saccharofermentans OX=1642647 GN=PSM36_3433 PE=4 SV=1
MM1 pKa = 7.76RR2 pKa = 11.84NFIRR6 pKa = 11.84RR7 pKa = 11.84IAILLSGSMQVPADD21 pKa = 3.7FLLFSIADD29 pKa = 3.34VRR31 pKa = 11.84LQFFKK36 pKa = 11.15VYY38 pKa = 10.17FII40 pKa = 5.0
MM1 pKa = 7.76RR2 pKa = 11.84NFIRR6 pKa = 11.84RR7 pKa = 11.84IAILLSGSMQVPADD21 pKa = 3.7FLLFSIADD29 pKa = 3.34VRR31 pKa = 11.84LQFFKK36 pKa = 11.15VYY38 pKa = 10.17FII40 pKa = 5.0
Molecular weight: 4.74 kDa
Isoelectric point according different methods:
Peptides (in silico digests for buttom-up proteomics)
Below you can find in silico digests of the whole proteome with Trypsin, Chymotrypsin, Trypsin+LysC, LysN, ArgC proteases suitable for different mass spec machines.| Try ESI |
 |
|---|
| ChTry ESI |
 |
|---|
| ArgC ESI |
 |
|---|
| LysN ESI |
 |
|---|
| TryLysC ESI |
 |
|---|
| Try MALDI |
 |
|---|
| ChTry MALDI |
 |
|---|
| ArgC MALDI |
 |
|---|
| LysN MALDI |
 |
|---|
| TryLysC MALDI |
 |
|---|
| Try LTQ |
 |
|---|
| ChTry LTQ |
 |
|---|
| ArgC LTQ |
 |
|---|
| LysN LTQ |
 |
|---|
| TryLysC LTQ |
 |
|---|
| Try MSlow |
 |
|---|
| ChTry MSlow |
 |
|---|
| ArgC MSlow |
 |
|---|
| LysN MSlow |
 |
|---|
| TryLysC MSlow |
 |
|---|
| Try MShigh |
 |
|---|
| ChTry MShigh |
 |
|---|
| ArgC MShigh |
 |
|---|
| LysN MShigh |
 |
|---|
| TryLysC MShigh |
 |
|---|
General Statistics
Number of major isoforms |
Number of additional isoforms |
Number of all proteins |
Number of amino acids |
Min. Seq. Length |
Max. Seq. Length |
Avg. Seq. Length |
Avg. Mol. Weight |
|---|---|---|---|---|---|---|---|
0 |
1306952 |
24 |
2576 |
386.6 |
43.69 |
Amino acid frequency
Ala |
Cys |
Asp |
Glu |
Phe |
Gly |
His |
Ile |
Lys |
Leu |
|---|---|---|---|---|---|---|---|---|---|
6.556 ± 0.037 | 0.834 ± 0.013 |
5.697 ± 0.03 | 6.684 ± 0.038 |
4.787 ± 0.026 | 7.05 ± 0.032 |
1.865 ± 0.017 | 7.314 ± 0.035 |
6.18 ± 0.036 | 8.979 ± 0.039 |
Met |
Asn |
Gln |
Pro |
Arg |
Ser |
Thr |
Val |
Trp |
Tyr |
|---|---|---|---|---|---|---|---|---|---|
2.532 ± 0.019 | 5.38 ± 0.039 |
3.955 ± 0.024 | 3.417 ± 0.021 |
4.82 ± 0.025 | 6.369 ± 0.033 |
5.556 ± 0.027 | 6.269 ± 0.03 |
1.364 ± 0.018 | 4.391 ± 0.032 |
Most of the basic statistics you can see at this page can be downloaded from this CSV file
Proteome-pI is available under Creative Commons Attribution-NoDerivs license, for more details see here
| Reference: Kozlowski LP. Proteome-pI 2.0: Proteome Isoelectric Point Database Update. Nucleic Acids Res. 2021, doi: 10.1093/nar/gkab944 | Contact: Lukasz P. Kozlowski |
