Ralstonia phage GP4
Taxonomy: Viruses; Duplodnaviria; Heunggongvirae; Uroviricota; Caudoviricetes; Caudovirales; Podoviridae; Gervaisevirus; Ralstonia virus GP4
Average proteome isoelectric point is 6.77
Get precalculated fractions of proteins

Virtual 2D-PAGE plot for 83 proteins (isoelectric point calculated using IPC2_protein)
Get csv file with sequences according to given criteria:
* You can choose from 21 different methods for calculating isoelectric point
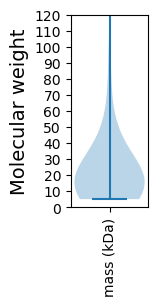
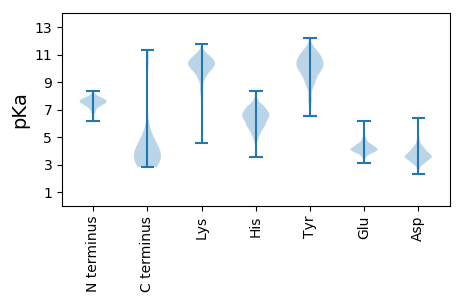
Summary statistics related to proteome-wise predictions


Protein with the lowest isoelectric point:
>tr|A0A345GU09|A0A345GU09_9CAUD Uncharacterized protein OS=Ralstonia phage GP4 OX=2282904 PE=4 SV=1
MM1 pKa = 7.53LGIVQKK7 pKa = 9.44TATEE11 pKa = 3.89QLDD14 pKa = 3.56YY15 pKa = 11.26DD16 pKa = 3.64IDD18 pKa = 3.85FARR21 pKa = 11.84WMPDD25 pKa = 2.51GDD27 pKa = 4.05VLQSAGVVITPDD39 pKa = 4.17DD40 pKa = 3.79GTLTSPAYY48 pKa = 9.76EE49 pKa = 3.73IDD51 pKa = 3.6GTVVKK56 pKa = 10.55VWLAGGTAGASYY68 pKa = 11.0NVDD71 pKa = 3.27VTVATAAGRR80 pKa = 11.84IKK82 pKa = 9.01EE83 pKa = 4.57TCFKK87 pKa = 10.53TRR89 pKa = 11.84VRR91 pKa = 11.84SCC93 pKa = 3.15
MM1 pKa = 7.53LGIVQKK7 pKa = 9.44TATEE11 pKa = 3.89QLDD14 pKa = 3.56YY15 pKa = 11.26DD16 pKa = 3.64IDD18 pKa = 3.85FARR21 pKa = 11.84WMPDD25 pKa = 2.51GDD27 pKa = 4.05VLQSAGVVITPDD39 pKa = 4.17DD40 pKa = 3.79GTLTSPAYY48 pKa = 9.76EE49 pKa = 3.73IDD51 pKa = 3.6GTVVKK56 pKa = 10.55VWLAGGTAGASYY68 pKa = 11.0NVDD71 pKa = 3.27VTVATAAGRR80 pKa = 11.84IKK82 pKa = 9.01EE83 pKa = 4.57TCFKK87 pKa = 10.53TRR89 pKa = 11.84VRR91 pKa = 11.84SCC93 pKa = 3.15
Molecular weight: 9.9 kDa
Isoelectric point according different methods:
Protein with the highest isoelectric point:
>tr|A0A345GTW0|A0A345GTW0_9CAUD IQ calmodulin-binding domain-containing family protein OS=Ralstonia phage GP4 OX=2282904 PE=4 SV=1
MM1 pKa = 7.55RR2 pKa = 11.84AIVDD6 pKa = 3.83GVEE9 pKa = 3.91IQIDD13 pKa = 3.92EE14 pKa = 4.44SDD16 pKa = 3.69LHH18 pKa = 7.27FMSLYY23 pKa = 9.3SWRR26 pKa = 11.84VQQQGSKK33 pKa = 9.87RR34 pKa = 11.84YY35 pKa = 9.25VRR37 pKa = 11.84ASTTRR42 pKa = 11.84KK43 pKa = 8.82GKK45 pKa = 10.12RR46 pKa = 11.84VTIYY50 pKa = 10.1LHH52 pKa = 7.14RR53 pKa = 11.84LITDD57 pKa = 3.8AGKK60 pKa = 10.86GVIVDD65 pKa = 4.15HH66 pKa = 6.88MDD68 pKa = 3.57GDD70 pKa = 3.98TMNNQRR76 pKa = 11.84SNFRR80 pKa = 11.84LGDD83 pKa = 3.38HH84 pKa = 7.45TINARR89 pKa = 11.84NARR92 pKa = 11.84KK93 pKa = 9.77IMARR97 pKa = 11.84TTSSRR102 pKa = 11.84FRR104 pKa = 11.84GVMLRR109 pKa = 11.84KK110 pKa = 9.89GKK112 pKa = 8.39WAARR116 pKa = 11.84IRR118 pKa = 11.84DD119 pKa = 3.96GVKK122 pKa = 10.05KK123 pKa = 10.52SAIEE127 pKa = 3.75LGQFSRR133 pKa = 11.84EE134 pKa = 3.61EE135 pKa = 3.93EE136 pKa = 3.53AAYY139 pKa = 10.05AYY141 pKa = 10.99DD142 pKa = 3.67MASLRR147 pKa = 11.84IHH149 pKa = 6.77GEE151 pKa = 3.41HH152 pKa = 6.68GRR154 pKa = 11.84RR155 pKa = 11.84NFLPLVFF162 pKa = 5.27
MM1 pKa = 7.55RR2 pKa = 11.84AIVDD6 pKa = 3.83GVEE9 pKa = 3.91IQIDD13 pKa = 3.92EE14 pKa = 4.44SDD16 pKa = 3.69LHH18 pKa = 7.27FMSLYY23 pKa = 9.3SWRR26 pKa = 11.84VQQQGSKK33 pKa = 9.87RR34 pKa = 11.84YY35 pKa = 9.25VRR37 pKa = 11.84ASTTRR42 pKa = 11.84KK43 pKa = 8.82GKK45 pKa = 10.12RR46 pKa = 11.84VTIYY50 pKa = 10.1LHH52 pKa = 7.14RR53 pKa = 11.84LITDD57 pKa = 3.8AGKK60 pKa = 10.86GVIVDD65 pKa = 4.15HH66 pKa = 6.88MDD68 pKa = 3.57GDD70 pKa = 3.98TMNNQRR76 pKa = 11.84SNFRR80 pKa = 11.84LGDD83 pKa = 3.38HH84 pKa = 7.45TINARR89 pKa = 11.84NARR92 pKa = 11.84KK93 pKa = 9.77IMARR97 pKa = 11.84TTSSRR102 pKa = 11.84FRR104 pKa = 11.84GVMLRR109 pKa = 11.84KK110 pKa = 9.89GKK112 pKa = 8.39WAARR116 pKa = 11.84IRR118 pKa = 11.84DD119 pKa = 3.96GVKK122 pKa = 10.05KK123 pKa = 10.52SAIEE127 pKa = 3.75LGQFSRR133 pKa = 11.84EE134 pKa = 3.61EE135 pKa = 3.93EE136 pKa = 3.53AAYY139 pKa = 10.05AYY141 pKa = 10.99DD142 pKa = 3.67MASLRR147 pKa = 11.84IHH149 pKa = 6.77GEE151 pKa = 3.41HH152 pKa = 6.68GRR154 pKa = 11.84RR155 pKa = 11.84NFLPLVFF162 pKa = 5.27
Molecular weight: 18.67 kDa
Isoelectric point according different methods:
Peptides (in silico digests for buttom-up proteomics)
Below you can find in silico digests of the whole proteome with Trypsin, Chymotrypsin, Trypsin+LysC, LysN, ArgC proteases suitable for different mass spec machines.| Try ESI |
 |
|---|
| ChTry ESI |
 |
|---|
| ArgC ESI |
 |
|---|
| LysN ESI |
 |
|---|
| TryLysC ESI |
 |
|---|
| Try MALDI |
 |
|---|
| ChTry MALDI |
 |
|---|
| ArgC MALDI |
 |
|---|
| LysN MALDI |
 |
|---|
| TryLysC MALDI |
 |
|---|
| Try LTQ |
 |
|---|
| ChTry LTQ |
 |
|---|
| ArgC LTQ |
 |
|---|
| LysN LTQ |
 |
|---|
| TryLysC LTQ |
 |
|---|
| Try MSlow |
 |
|---|
| ChTry MSlow |
 |
|---|
| ArgC MSlow |
 |
|---|
| LysN MSlow |
 |
|---|
| TryLysC MSlow |
 |
|---|
| Try MShigh |
 |
|---|
| ChTry MShigh |
 |
|---|
| ArgC MShigh |
 |
|---|
| LysN MShigh |
 |
|---|
| TryLysC MShigh |
 |
|---|
General Statistics
Number of major isoforms |
Number of additional isoforms |
Number of all proteins |
Number of amino acids |
Min. Seq. Length |
Max. Seq. Length |
Avg. Seq. Length |
Avg. Mol. Weight |
|---|---|---|---|---|---|---|---|
0 |
18700 |
47 |
3224 |
225.3 |
24.49 |
Amino acid frequency
Ala |
Cys |
Asp |
Glu |
Phe |
Gly |
His |
Ile |
Lys |
Leu |
|---|---|---|---|---|---|---|---|---|---|
13.471 ± 0.537 | 0.872 ± 0.177 |
6.112 ± 0.181 | 6.273 ± 0.276 |
2.925 ± 0.192 | 8.61 ± 0.413 |
1.995 ± 0.17 | 4.567 ± 0.33 |
4.513 ± 0.275 | 6.882 ± 0.2 |
Met |
Asn |
Gln |
Pro |
Arg |
Ser |
Thr |
Val |
Trp |
Tyr |
|---|---|---|---|---|---|---|---|---|---|
2.663 ± 0.155 | 3.513 ± 0.22 |
4.797 ± 0.209 | 4.134 ± 0.197 |
7.278 ± 0.283 | 5.594 ± 0.252 |
5.594 ± 0.263 | 6.294 ± 0.167 |
1.406 ± 0.142 | 2.508 ± 0.114 |
Most of the basic statistics you can see at this page can be downloaded from this CSV file
Proteome-pI is available under Creative Commons Attribution-NoDerivs license, for more details see here
| Reference: Kozlowski LP. Proteome-pI 2.0: Proteome Isoelectric Point Database Update. Nucleic Acids Res. 2021, doi: 10.1093/nar/gkab944 | Contact: Lukasz P. Kozlowski |
