Facklamia hominis CCUG 36813
Taxonomy: cellular organisms; Bacteria; Terrabacteria group; Firmicutes; Bacilli; Lactobacillales; Aerococcaceae; Facklamia; Facklamia hominis
Average proteome isoelectric point is 6.15
Get precalculated fractions of proteins

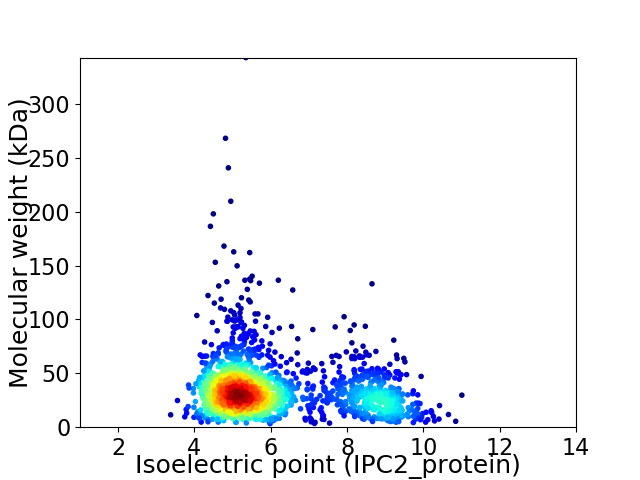
Virtual 2D-PAGE plot for 1717 proteins (isoelectric point calculated using IPC2_protein)
Get csv file with sequences according to given criteria:
* You can choose from 21 different methods for calculating isoelectric point
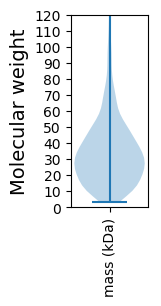
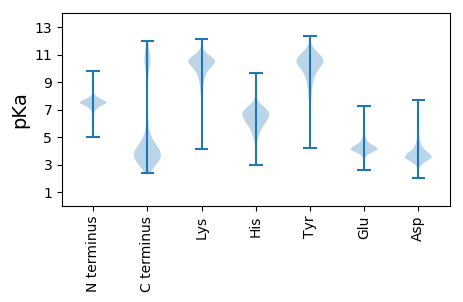
Summary statistics related to proteome-wise predictions


Protein with the lowest isoelectric point:
>tr|K1LRY1|K1LRY1_9LACT Tetracycline resistance protein tetM OS=Facklamia hominis CCUG 36813 OX=883111 GN=HMPREF9706_01072 PE=3 SV=1
MM1 pKa = 7.34TNEE4 pKa = 4.33EE5 pKa = 4.76LEE7 pKa = 4.37SMIQEE12 pKa = 3.49IHH14 pKa = 6.48KK15 pKa = 10.57NIVEE19 pKa = 4.21NEE21 pKa = 4.0YY22 pKa = 11.19SSDD25 pKa = 3.95SIKK28 pKa = 11.22DD29 pKa = 3.43KK30 pKa = 11.05LADD33 pKa = 3.69YY34 pKa = 11.26ADD36 pKa = 5.02DD37 pKa = 5.55DD38 pKa = 4.62DD39 pKa = 6.33AISSSSLVAFVLNEE53 pKa = 3.73NRR55 pKa = 11.84HH56 pKa = 4.59YY57 pKa = 8.46TCTMIYY63 pKa = 10.49SLFSRR68 pKa = 11.84LLDD71 pKa = 3.1QGYY74 pKa = 9.48FSDD77 pKa = 5.57DD78 pKa = 3.49NPP80 pKa = 3.72
MM1 pKa = 7.34TNEE4 pKa = 4.33EE5 pKa = 4.76LEE7 pKa = 4.37SMIQEE12 pKa = 3.49IHH14 pKa = 6.48KK15 pKa = 10.57NIVEE19 pKa = 4.21NEE21 pKa = 4.0YY22 pKa = 11.19SSDD25 pKa = 3.95SIKK28 pKa = 11.22DD29 pKa = 3.43KK30 pKa = 11.05LADD33 pKa = 3.69YY34 pKa = 11.26ADD36 pKa = 5.02DD37 pKa = 5.55DD38 pKa = 4.62DD39 pKa = 6.33AISSSSLVAFVLNEE53 pKa = 3.73NRR55 pKa = 11.84HH56 pKa = 4.59YY57 pKa = 8.46TCTMIYY63 pKa = 10.49SLFSRR68 pKa = 11.84LLDD71 pKa = 3.1QGYY74 pKa = 9.48FSDD77 pKa = 5.57DD78 pKa = 3.49NPP80 pKa = 3.72
Molecular weight: 9.21 kDa
Isoelectric point according different methods:
Protein with the highest isoelectric point:
>tr|K1LR34|K1LR34_9LACT Uncharacterized protein OS=Facklamia hominis CCUG 36813 OX=883111 GN=HMPREF9706_00767 PE=4 SV=1
LL1 pKa = 7.37NSISVTISTLFSTLNATRR19 pKa = 11.84VTISTIFSTLKK30 pKa = 10.24ALRR33 pKa = 11.84VTISTLFSTLNSISVTISTLFSTLSAMRR61 pKa = 11.84VTIPTRR67 pKa = 11.84CSTLNSIRR75 pKa = 11.84VTISTPFSTLSSISVTISTLFSTLNTARR103 pKa = 11.84VTISTLFSTLSPTRR117 pKa = 11.84ATIATLFGTLRR128 pKa = 11.84TLRR131 pKa = 11.84VTIPPHH137 pKa = 6.25FSTLRR142 pKa = 11.84TLRR145 pKa = 11.84ITISTRR151 pKa = 11.84FGTLSSLRR159 pKa = 11.84VTIPTRR165 pKa = 11.84FGTLRR170 pKa = 11.84TLRR173 pKa = 11.84VTIYY177 pKa = 10.39TRR179 pKa = 11.84FSTLSPTRR187 pKa = 11.84VTIPTRR193 pKa = 11.84CSTLSTLRR201 pKa = 11.84VTISTHH207 pKa = 5.94FSTLSSLRR215 pKa = 11.84VTIYY219 pKa = 10.53TRR221 pKa = 11.84FSTLSSISVTISTRR235 pKa = 11.84FSTLNTARR243 pKa = 11.84VTISTLFSTLSPTRR257 pKa = 11.84VTISTLFSTLSPISVTT273 pKa = 3.61
LL1 pKa = 7.37NSISVTISTLFSTLNATRR19 pKa = 11.84VTISTIFSTLKK30 pKa = 10.24ALRR33 pKa = 11.84VTISTLFSTLNSISVTISTLFSTLSAMRR61 pKa = 11.84VTIPTRR67 pKa = 11.84CSTLNSIRR75 pKa = 11.84VTISTPFSTLSSISVTISTLFSTLNTARR103 pKa = 11.84VTISTLFSTLSPTRR117 pKa = 11.84ATIATLFGTLRR128 pKa = 11.84TLRR131 pKa = 11.84VTIPPHH137 pKa = 6.25FSTLRR142 pKa = 11.84TLRR145 pKa = 11.84ITISTRR151 pKa = 11.84FGTLSSLRR159 pKa = 11.84VTIPTRR165 pKa = 11.84FGTLRR170 pKa = 11.84TLRR173 pKa = 11.84VTIYY177 pKa = 10.39TRR179 pKa = 11.84FSTLSPTRR187 pKa = 11.84VTIPTRR193 pKa = 11.84CSTLSTLRR201 pKa = 11.84VTISTHH207 pKa = 5.94FSTLSSLRR215 pKa = 11.84VTIYY219 pKa = 10.53TRR221 pKa = 11.84FSTLSSISVTISTRR235 pKa = 11.84FSTLNTARR243 pKa = 11.84VTISTLFSTLSPTRR257 pKa = 11.84VTISTLFSTLSPISVTT273 pKa = 3.61
Molecular weight: 29.74 kDa
Isoelectric point according different methods:
Peptides (in silico digests for buttom-up proteomics)
Below you can find in silico digests of the whole proteome with Trypsin, Chymotrypsin, Trypsin+LysC, LysN, ArgC proteases suitable for different mass spec machines.| Try ESI |
 |
|---|
| ChTry ESI |
 |
|---|
| ArgC ESI |
 |
|---|
| LysN ESI |
 |
|---|
| TryLysC ESI |
 |
|---|
| Try MALDI |
 |
|---|
| ChTry MALDI |
 |
|---|
| ArgC MALDI |
 |
|---|
| LysN MALDI |
 |
|---|
| TryLysC MALDI |
 |
|---|
| Try LTQ |
 |
|---|
| ChTry LTQ |
 |
|---|
| ArgC LTQ |
 |
|---|
| LysN LTQ |
 |
|---|
| TryLysC LTQ |
 |
|---|
| Try MSlow |
 |
|---|
| ChTry MSlow |
 |
|---|
| ArgC MSlow |
 |
|---|
| LysN MSlow |
 |
|---|
| TryLysC MSlow |
 |
|---|
| Try MShigh |
 |
|---|
| ChTry MShigh |
 |
|---|
| ArgC MShigh |
 |
|---|
| LysN MShigh |
 |
|---|
| TryLysC MShigh |
 |
|---|
General Statistics
Number of major isoforms |
Number of additional isoforms |
Number of all proteins |
Number of amino acids |
Min. Seq. Length |
Max. Seq. Length |
Avg. Seq. Length |
Avg. Mol. Weight |
|---|---|---|---|---|---|---|---|
0 |
552778 |
29 |
3044 |
321.9 |
36.29 |
Amino acid frequency
Ala |
Cys |
Asp |
Glu |
Phe |
Gly |
His |
Ile |
Lys |
Leu |
|---|---|---|---|---|---|---|---|---|---|
7.218 ± 0.056 | 0.716 ± 0.017 |
5.977 ± 0.061 | 6.669 ± 0.078 |
4.231 ± 0.056 | 6.216 ± 0.058 |
2.062 ± 0.027 | 7.407 ± 0.07 |
6.248 ± 0.064 | 10.534 ± 0.09 |
Met |
Asn |
Gln |
Pro |
Arg |
Ser |
Thr |
Val |
Trp |
Tyr |
|---|---|---|---|---|---|---|---|---|---|
2.555 ± 0.032 | 4.387 ± 0.044 |
3.552 ± 0.041 | 5.352 ± 0.069 |
4.176 ± 0.042 | 6.362 ± 0.053 |
4.924 ± 0.054 | 6.464 ± 0.044 |
0.918 ± 0.02 | 4.031 ± 0.037 |
Most of the basic statistics you can see at this page can be downloaded from this CSV file
Proteome-pI is available under Creative Commons Attribution-NoDerivs license, for more details see here
| Reference: Kozlowski LP. Proteome-pI 2.0: Proteome Isoelectric Point Database Update. Nucleic Acids Res. 2021, doi: 10.1093/nar/gkab944 | Contact: Lukasz P. Kozlowski |
