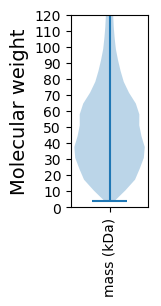
Cladophialophora immunda
Taxonomy: cellular organisms; Eukaryota; Opisthokonta; Fungi; Dikarya; Ascomycota; saccharomyceta; Pezizomycotina; leotiomyceta; Eurotiomycetes; Chaetothyriomycetidae; Chaetothyriales; Herpotrichiellaceae; Cladophialophora
Average proteome isoelectric point is 6.5
Get precalculated fractions of proteins

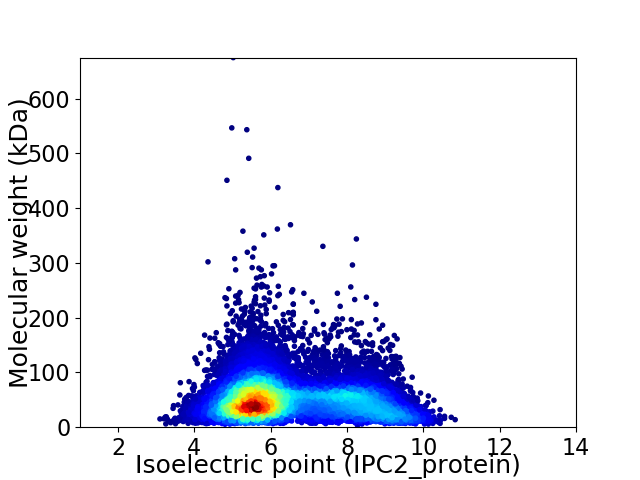
Virtual 2D-PAGE plot for 13606 proteins (isoelectric point calculated using IPC2_protein)
Get csv file with sequences according to given criteria:
* You can choose from 21 different methods for calculating isoelectric point
Summary statistics related to proteome-wise predictions


Protein with the lowest isoelectric point:
>tr|A0A0D2BWH6|A0A0D2BWH6_9EURO Uncharacterized protein OS=Cladophialophora immunda OX=569365 GN=PV07_11612 PE=4 SV=1
QQ1 pKa = 6.77QPALAVYY8 pKa = 9.45QLIQDD13 pKa = 3.94YY14 pKa = 11.13SSDD17 pKa = 3.82AFWQGFDD24 pKa = 4.29FFTDD28 pKa = 3.74PDD30 pKa = 3.85PTDD33 pKa = 3.8ALVQFQSLEE42 pKa = 3.89QANATGIAGFIEE54 pKa = 4.58GGNASFAIYY63 pKa = 9.63MGVDD67 pKa = 3.55TEE69 pKa = 4.47NVAPQGRR76 pKa = 11.84ASVGVSSSQSFQHH89 pKa = 6.39ALVIADD95 pKa = 3.73IVHH98 pKa = 5.95MPGGVCGSWPAFWMVGANWPNNGEE122 pKa = 3.77IDD124 pKa = 3.41IVEE127 pKa = 4.36GVNDD131 pKa = 3.61QPTNSMTLHH140 pKa = 6.53TGQGAVVSNGTDD152 pKa = 3.58FSGEE156 pKa = 4.64LITSNCDD163 pKa = 2.9AGGGVLATEE172 pKa = 4.61WTADD176 pKa = 4.11FIKK179 pKa = 10.11IWFFPRR185 pKa = 11.84GTFPDD190 pKa = 5.33DD191 pKa = 3.13IVSSNPTPSEE201 pKa = 3.51NWGTRR206 pKa = 11.84NSLFQGSFNLDD217 pKa = 3.09DD218 pKa = 4.85HH219 pKa = 6.99FNNLQIVFDD228 pKa = 4.02TTFCGQQ234 pKa = 3.02
QQ1 pKa = 6.77QPALAVYY8 pKa = 9.45QLIQDD13 pKa = 3.94YY14 pKa = 11.13SSDD17 pKa = 3.82AFWQGFDD24 pKa = 4.29FFTDD28 pKa = 3.74PDD30 pKa = 3.85PTDD33 pKa = 3.8ALVQFQSLEE42 pKa = 3.89QANATGIAGFIEE54 pKa = 4.58GGNASFAIYY63 pKa = 9.63MGVDD67 pKa = 3.55TEE69 pKa = 4.47NVAPQGRR76 pKa = 11.84ASVGVSSSQSFQHH89 pKa = 6.39ALVIADD95 pKa = 3.73IVHH98 pKa = 5.95MPGGVCGSWPAFWMVGANWPNNGEE122 pKa = 3.77IDD124 pKa = 3.41IVEE127 pKa = 4.36GVNDD131 pKa = 3.61QPTNSMTLHH140 pKa = 6.53TGQGAVVSNGTDD152 pKa = 3.58FSGEE156 pKa = 4.64LITSNCDD163 pKa = 2.9AGGGVLATEE172 pKa = 4.61WTADD176 pKa = 4.11FIKK179 pKa = 10.11IWFFPRR185 pKa = 11.84GTFPDD190 pKa = 5.33DD191 pKa = 3.13IVSSNPTPSEE201 pKa = 3.51NWGTRR206 pKa = 11.84NSLFQGSFNLDD217 pKa = 3.09DD218 pKa = 4.85HH219 pKa = 6.99FNNLQIVFDD228 pKa = 4.02TTFCGQQ234 pKa = 3.02
Molecular weight: 25.18 kDa
Isoelectric point according different methods:
Protein with the highest isoelectric point:
>tr|A0A0D2CWI6|A0A0D2CWI6_9EURO RNA exonuclease 4 OS=Cladophialophora immunda OX=569365 GN=PV07_01051 PE=3 SV=1
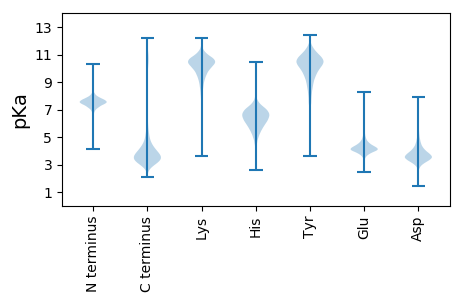
MM1 pKa = 7.12QYY3 pKa = 10.62RR4 pKa = 11.84RR5 pKa = 11.84IILEE9 pKa = 3.59QRR11 pKa = 11.84RR12 pKa = 11.84KK13 pKa = 10.28CSEE16 pKa = 4.18DD17 pKa = 3.43KK18 pKa = 10.84DD19 pKa = 4.19GKK21 pKa = 7.06QQRR24 pKa = 11.84GQEE27 pKa = 4.43LNPDD31 pKa = 3.45WAVTGAATRR40 pKa = 11.84TSLSLKK46 pKa = 10.01AAVAPRR52 pKa = 11.84RR53 pKa = 11.84RR54 pKa = 11.84SIFSRR59 pKa = 11.84QGVALVPCRR68 pKa = 11.84QSLDD72 pKa = 3.36RR73 pKa = 11.84RR74 pKa = 11.84VKK76 pKa = 9.63LQGIKK81 pKa = 10.44DD82 pKa = 3.58HH83 pKa = 6.94ASPIVRR89 pKa = 11.84LPYY92 pKa = 10.4SYY94 pKa = 11.14AAWTSGFPPLCCRR107 pKa = 11.84ITHH110 pKa = 6.25SKK112 pKa = 10.21HH113 pKa = 5.34LWLEE117 pKa = 4.01RR118 pKa = 11.84SRR120 pKa = 11.84CVCII124 pKa = 4.63
MM1 pKa = 7.12QYY3 pKa = 10.62RR4 pKa = 11.84RR5 pKa = 11.84IILEE9 pKa = 3.59QRR11 pKa = 11.84RR12 pKa = 11.84KK13 pKa = 10.28CSEE16 pKa = 4.18DD17 pKa = 3.43KK18 pKa = 10.84DD19 pKa = 4.19GKK21 pKa = 7.06QQRR24 pKa = 11.84GQEE27 pKa = 4.43LNPDD31 pKa = 3.45WAVTGAATRR40 pKa = 11.84TSLSLKK46 pKa = 10.01AAVAPRR52 pKa = 11.84RR53 pKa = 11.84RR54 pKa = 11.84SIFSRR59 pKa = 11.84QGVALVPCRR68 pKa = 11.84QSLDD72 pKa = 3.36RR73 pKa = 11.84RR74 pKa = 11.84VKK76 pKa = 9.63LQGIKK81 pKa = 10.44DD82 pKa = 3.58HH83 pKa = 6.94ASPIVRR89 pKa = 11.84LPYY92 pKa = 10.4SYY94 pKa = 11.14AAWTSGFPPLCCRR107 pKa = 11.84ITHH110 pKa = 6.25SKK112 pKa = 10.21HH113 pKa = 5.34LWLEE117 pKa = 4.01RR118 pKa = 11.84SRR120 pKa = 11.84CVCII124 pKa = 4.63
Molecular weight: 14.23 kDa
Isoelectric point according different methods:
Peptides (in silico digests for buttom-up proteomics)
Below you can find in silico digests of the whole proteome with Trypsin, Chymotrypsin, Trypsin+LysC, LysN, ArgC proteases suitable for different mass spec machines.| Try ESI |
 |
|---|
| ChTry ESI |
 |
|---|
| ArgC ESI |
 |
|---|
| LysN ESI |
 |
|---|
| TryLysC ESI |
 |
|---|
| Try MALDI |
 |
|---|
| ChTry MALDI |
 |
|---|
| ArgC MALDI |
 |
|---|
| LysN MALDI |
 |
|---|
| TryLysC MALDI |
 |
|---|
| Try LTQ |
 |
|---|
| ChTry LTQ |
 |
|---|
| ArgC LTQ |
 |
|---|
| LysN LTQ |
 |
|---|
| TryLysC LTQ |
 |
|---|
| Try MSlow |
 |
|---|
| ChTry MSlow |
 |
|---|
| ArgC MSlow |
 |
|---|
| LysN MSlow |
 |
|---|
| TryLysC MSlow |
 |
|---|
| Try MShigh |
 |
|---|
| ChTry MShigh |
 |
|---|
| ArgC MShigh |
 |
|---|
| LysN MShigh |
 |
|---|
| TryLysC MShigh |
 |
|---|
General Statistics
Number of major isoforms |
Number of additional isoforms |
Number of all proteins |
Number of amino acids |
Min. Seq. Length |
Max. Seq. Length |
Avg. Seq. Length |
Avg. Mol. Weight |
|---|---|---|---|---|---|---|---|
6726764 |
31 |
6211 |
494.4 |
54.77 |
Amino acid frequency
Ala |
Cys |
Asp |
Glu |
Phe |
Gly |
His |
Ile |
Lys |
Leu |
|---|---|---|---|---|---|---|---|---|---|
8.674 ± 0.018 | 1.296 ± 0.008 |
5.691 ± 0.014 | 6.102 ± 0.018 |
3.719 ± 0.012 | 6.768 ± 0.017 |
2.494 ± 0.009 | 4.796 ± 0.013 |
4.622 ± 0.016 | 9.062 ± 0.02 |
Met |
Asn |
Gln |
Pro |
Arg |
Ser |
Thr |
Val |
Trp |
Tyr |
|---|---|---|---|---|---|---|---|---|---|
2.167 ± 0.008 | 3.512 ± 0.009 |
6.109 ± 0.019 | 4.167 ± 0.012 |
6.328 ± 0.017 | 8.202 ± 0.021 |
5.973 ± 0.016 | 6.106 ± 0.012 |
1.485 ± 0.008 | 2.726 ± 0.011 |
Most of the basic statistics you can see at this page can be downloaded from this CSV file
Proteome-pI is available under Creative Commons Attribution-NoDerivs license, for more details see here
| Reference: Kozlowski LP. Proteome-pI 2.0: Proteome Isoelectric Point Database Update. Nucleic Acids Res. 2021, doi: 10.1093/nar/gkab944 | Contact: Lukasz P. Kozlowski |
