Astyanax mexicanus (Blind cave fish) (Astyanax fasciatus mexicanus)
Taxonomy: cellular organisms; Eukaryota; Opisthokonta; Metazoa; Eumetazoa; Bilateria; Deuterostomia; Chordata; Craniata; Vertebrata; Gnathostomata; Teleostomi; Euteleostomi; Actinopterygii; Actinopteri; Neopterygii; Teleostei; Osteoglossocephalai; Clupeocephala; Otomorpha; Ostariophysi;
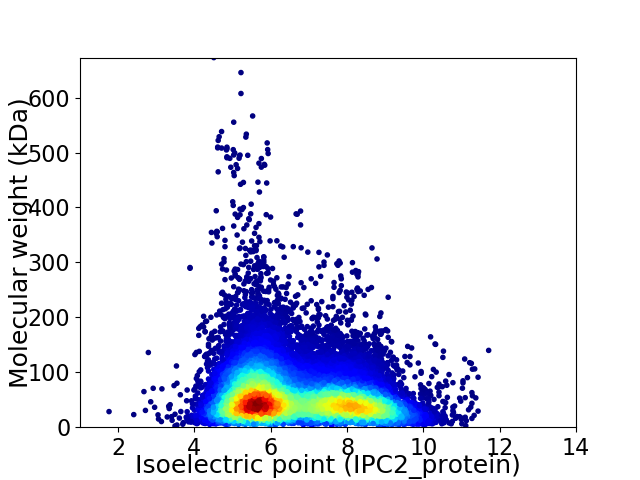
Average proteome isoelectric point is 6.63
Get precalculated fractions of proteins

Virtual 2D-PAGE plot for 39383 proteins (isoelectric point calculated using IPC2_protein)
Get csv file with sequences according to given criteria:
* You can choose from 21 different methods for calculating isoelectric point
Summary statistics related to proteome-wise predictions


Protein with the lowest isoelectric point:
>tr|A0A3B1J2H5|A0A3B1J2H5_ASTMX Uncharacterized protein OS=Astyanax mexicanus OX=7994 PE=4 SV=1
MM1 pKa = 7.81AEE3 pKa = 4.11DD4 pKa = 5.21HH5 pKa = 6.73GLCDD9 pKa = 3.86GNGPIDD15 pKa = 3.62VTEE18 pKa = 4.08SLEE21 pKa = 4.12LLLLAVTDD29 pKa = 4.4YY30 pKa = 11.12IVLLDD35 pKa = 4.25GVQCLLFTFQLDD47 pKa = 3.98DD48 pKa = 3.63VGVRR52 pKa = 11.84DD53 pKa = 5.05DD54 pKa = 5.56ALIQHH59 pKa = 6.18KK60 pKa = 10.17HH61 pKa = 4.87IDD63 pKa = 3.66FLGVDD68 pKa = 4.0KK69 pKa = 11.11PEE71 pKa = 4.46LLAPVQDD78 pKa = 4.18CSRR81 pKa = 11.84GANHH85 pKa = 6.8NLLLNTAASSDD96 pKa = 3.64LSEE99 pKa = 4.61EE100 pKa = 4.87LPLDD104 pKa = 3.67WLCSLDD110 pKa = 3.75YY111 pKa = 10.88FF112 pKa = 5.15
MM1 pKa = 7.81AEE3 pKa = 4.11DD4 pKa = 5.21HH5 pKa = 6.73GLCDD9 pKa = 3.86GNGPIDD15 pKa = 3.62VTEE18 pKa = 4.08SLEE21 pKa = 4.12LLLLAVTDD29 pKa = 4.4YY30 pKa = 11.12IVLLDD35 pKa = 4.25GVQCLLFTFQLDD47 pKa = 3.98DD48 pKa = 3.63VGVRR52 pKa = 11.84DD53 pKa = 5.05DD54 pKa = 5.56ALIQHH59 pKa = 6.18KK60 pKa = 10.17HH61 pKa = 4.87IDD63 pKa = 3.66FLGVDD68 pKa = 4.0KK69 pKa = 11.11PEE71 pKa = 4.46LLAPVQDD78 pKa = 4.18CSRR81 pKa = 11.84GANHH85 pKa = 6.8NLLLNTAASSDD96 pKa = 3.64LSEE99 pKa = 4.61EE100 pKa = 4.87LPLDD104 pKa = 3.67WLCSLDD110 pKa = 3.75YY111 pKa = 10.88FF112 pKa = 5.15
Molecular weight: 12.31 kDa
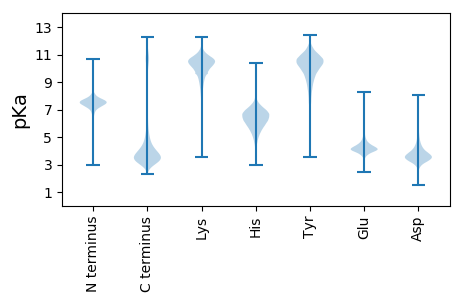
Isoelectric point according different methods:
Protein with the highest isoelectric point:
>tr|A0A3B1KIV2|A0A3B1KIV2_ASTMX 40S ribosomal protein S6 OS=Astyanax mexicanus OX=7994 PE=3 SV=1
SS1 pKa = 7.19RR2 pKa = 11.84PGLRR6 pKa = 11.84AGSRR10 pKa = 11.84PGLRR14 pKa = 11.84AGSRR18 pKa = 11.84PGLRR22 pKa = 11.84AGSRR26 pKa = 11.84PGLRR30 pKa = 11.84AGSRR34 pKa = 11.84PGLRR38 pKa = 11.84AGSRR42 pKa = 11.84PGLRR46 pKa = 11.84AGSRR50 pKa = 11.84PGLRR54 pKa = 11.84AGSRR58 pKa = 11.84PGLRR62 pKa = 11.84AGSRR66 pKa = 11.84PGLRR70 pKa = 11.84AGSRR74 pKa = 11.84PGLRR78 pKa = 11.84AGSRR82 pKa = 11.84PGLRR86 pKa = 11.84AGSRR90 pKa = 11.84PGLRR94 pKa = 11.84AGSRR98 pKa = 11.84PGLRR102 pKa = 11.84AGSRR106 pKa = 11.84PGLRR110 pKa = 11.84AGSRR114 pKa = 11.84PGLRR118 pKa = 11.84AGSRR122 pKa = 11.84PGLRR126 pKa = 11.84AGSRR130 pKa = 11.84PGLRR134 pKa = 11.84AGSRR138 pKa = 11.84PGLRR142 pKa = 11.84AGSRR146 pKa = 11.84HH147 pKa = 6.31CSHH150 pKa = 6.78CVWGQKK156 pKa = 10.4LNN158 pKa = 3.65
SS1 pKa = 7.19RR2 pKa = 11.84PGLRR6 pKa = 11.84AGSRR10 pKa = 11.84PGLRR14 pKa = 11.84AGSRR18 pKa = 11.84PGLRR22 pKa = 11.84AGSRR26 pKa = 11.84PGLRR30 pKa = 11.84AGSRR34 pKa = 11.84PGLRR38 pKa = 11.84AGSRR42 pKa = 11.84PGLRR46 pKa = 11.84AGSRR50 pKa = 11.84PGLRR54 pKa = 11.84AGSRR58 pKa = 11.84PGLRR62 pKa = 11.84AGSRR66 pKa = 11.84PGLRR70 pKa = 11.84AGSRR74 pKa = 11.84PGLRR78 pKa = 11.84AGSRR82 pKa = 11.84PGLRR86 pKa = 11.84AGSRR90 pKa = 11.84PGLRR94 pKa = 11.84AGSRR98 pKa = 11.84PGLRR102 pKa = 11.84AGSRR106 pKa = 11.84PGLRR110 pKa = 11.84AGSRR114 pKa = 11.84PGLRR118 pKa = 11.84AGSRR122 pKa = 11.84PGLRR126 pKa = 11.84AGSRR130 pKa = 11.84PGLRR134 pKa = 11.84AGSRR138 pKa = 11.84PGLRR142 pKa = 11.84AGSRR146 pKa = 11.84HH147 pKa = 6.31CSHH150 pKa = 6.78CVWGQKK156 pKa = 10.4LNN158 pKa = 3.65
Molecular weight: 15.96 kDa
Isoelectric point according different methods:
Peptides (in silico digests for buttom-up proteomics)
Below you can find in silico digests of the whole proteome with Trypsin, Chymotrypsin, Trypsin+LysC, LysN, ArgC proteases suitable for different mass spec machines.| Try ESI |
 |
|---|
| ChTry ESI |
 |
|---|
| ArgC ESI |
 |
|---|
| LysN ESI |
 |
|---|
| TryLysC ESI |
 |
|---|
| Try MALDI |
 |
|---|
| ChTry MALDI |
 |
|---|
| ArgC MALDI |
 |
|---|
| LysN MALDI |
 |
|---|
| TryLysC MALDI |
 |
|---|
| Try LTQ |
 |
|---|
| ChTry LTQ |
 |
|---|
| ArgC LTQ |
 |
|---|
| LysN LTQ |
 |
|---|
| TryLysC LTQ |
 |
|---|
| Try MSlow |
 |
|---|
| ChTry MSlow |
 |
|---|
| ArgC MSlow |
 |
|---|
| LysN MSlow |
 |
|---|
| TryLysC MSlow |
 |
|---|
| Try MShigh |
 |
|---|
| ChTry MShigh |
 |
|---|
| ArgC MShigh |
 |
|---|
| LysN MShigh |
 |
|---|
| TryLysC MShigh |
 |
|---|
General Statistics
Number of major isoforms |
Number of additional isoforms |
Number of all proteins |
Number of amino acids |
Min. Seq. Length |
Max. Seq. Length |
Avg. Seq. Length |
Avg. Mol. Weight |
|---|---|---|---|---|---|---|---|
22005327 |
18 |
8606 |
558.8 |
62.41 |
Amino acid frequency
Ala |
Cys |
Asp |
Glu |
Phe |
Gly |
His |
Ile |
Lys |
Leu |
|---|---|---|---|---|---|---|---|---|---|
6.495 ± 0.013 | 2.317 ± 0.011 |
5.045 ± 0.008 | 6.895 ± 0.016 |
3.643 ± 0.01 | 6.172 ± 0.016 |
2.657 ± 0.009 | 4.422 ± 0.01 |
5.721 ± 0.018 | 9.494 ± 0.017 |
Met |
Asn |
Gln |
Pro |
Arg |
Ser |
Thr |
Val |
Trp |
Tyr |
|---|---|---|---|---|---|---|---|---|---|
2.29 ± 0.005 | 3.859 ± 0.007 |
5.778 ± 0.02 | 4.747 ± 0.012 |
5.623 ± 0.012 | 8.829 ± 0.018 |
5.703 ± 0.013 | 6.368 ± 0.011 |
1.154 ± 0.005 | 2.786 ± 0.008 |
Most of the basic statistics you can see at this page can be downloaded from this CSV file
Proteome-pI is available under Creative Commons Attribution-NoDerivs license, for more details see here
| Reference: Kozlowski LP. Proteome-pI 2.0: Proteome Isoelectric Point Database Update. Nucleic Acids Res. 2021, doi: 10.1093/nar/gkab944 | Contact: Lukasz P. Kozlowski |
