Filibacter tadaridae
Taxonomy: cellular organisms; Bacteria; Terrabacteria group; Firmicutes; Bacilli; Bacillales; Planococcaceae; Filibacter
Average proteome isoelectric point is 6.2
Get precalculated fractions of proteins

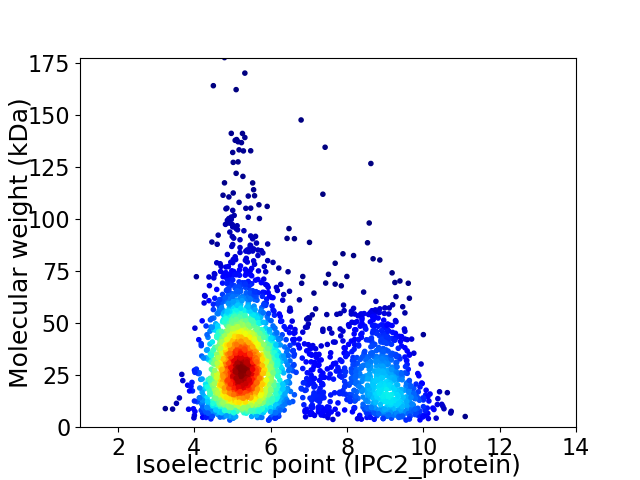
Virtual 2D-PAGE plot for 3039 proteins (isoelectric point calculated using IPC2_protein)
Get csv file with sequences according to given criteria:
* You can choose from 21 different methods for calculating isoelectric point
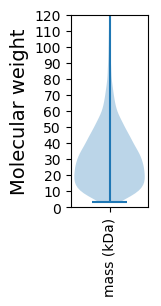
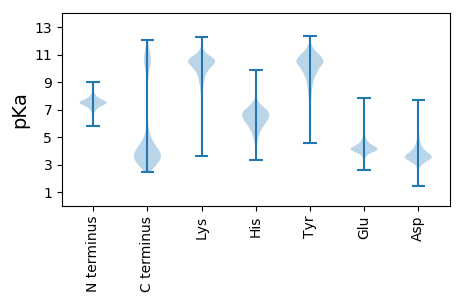
Summary statistics related to proteome-wise predictions


Protein with the lowest isoelectric point:
>tr|A0A3P5X1R8|A0A3P5X1R8_9BACL Transposase DDE domain protein OS=Filibacter tadaridae OX=2483811 GN=FILTAD_01195 PE=4 SV=1
MM1 pKa = 7.64RR2 pKa = 11.84NILIAYY8 pKa = 8.33TSMTGNTEE16 pKa = 3.82EE17 pKa = 4.18LAEE20 pKa = 4.05IAKK23 pKa = 10.11VVLTGRR29 pKa = 11.84GFDD32 pKa = 3.51VTVKK36 pKa = 10.07TFDD39 pKa = 3.81AEE41 pKa = 4.24AIAAKK46 pKa = 10.32EE47 pKa = 3.58FLAYY51 pKa = 10.35DD52 pKa = 4.73GILFGTYY59 pKa = 9.37TYY61 pKa = 11.44DD62 pKa = 4.99DD63 pKa = 4.05GNLPYY68 pKa = 10.05EE69 pKa = 4.18IEE71 pKa = 4.09EE72 pKa = 4.66TYY74 pKa = 11.54DD75 pKa = 3.93DD76 pKa = 5.28LDD78 pKa = 3.9TVSFTDD84 pKa = 3.24KK85 pKa = 10.74VVGVFGSGDD94 pKa = 2.99SCYY97 pKa = 11.06YY98 pKa = 9.24EE99 pKa = 4.57FCHH102 pKa = 6.19ATDD105 pKa = 4.09LMAEE109 pKa = 4.35KK110 pKa = 9.01FTEE113 pKa = 4.39VGAHH117 pKa = 4.81VVDD120 pKa = 5.12SIVKK124 pKa = 9.77VDD126 pKa = 5.44LDD128 pKa = 3.72AQQADD133 pKa = 4.2VDD135 pKa = 4.1RR136 pKa = 11.84MQAMVNMFCDD146 pKa = 4.98AIDD149 pKa = 3.42QRR151 pKa = 11.84LEE153 pKa = 3.99DD154 pKa = 3.51SCAA157 pKa = 3.2
MM1 pKa = 7.64RR2 pKa = 11.84NILIAYY8 pKa = 8.33TSMTGNTEE16 pKa = 3.82EE17 pKa = 4.18LAEE20 pKa = 4.05IAKK23 pKa = 10.11VVLTGRR29 pKa = 11.84GFDD32 pKa = 3.51VTVKK36 pKa = 10.07TFDD39 pKa = 3.81AEE41 pKa = 4.24AIAAKK46 pKa = 10.32EE47 pKa = 3.58FLAYY51 pKa = 10.35DD52 pKa = 4.73GILFGTYY59 pKa = 9.37TYY61 pKa = 11.44DD62 pKa = 4.99DD63 pKa = 4.05GNLPYY68 pKa = 10.05EE69 pKa = 4.18IEE71 pKa = 4.09EE72 pKa = 4.66TYY74 pKa = 11.54DD75 pKa = 3.93DD76 pKa = 5.28LDD78 pKa = 3.9TVSFTDD84 pKa = 3.24KK85 pKa = 10.74VVGVFGSGDD94 pKa = 2.99SCYY97 pKa = 11.06YY98 pKa = 9.24EE99 pKa = 4.57FCHH102 pKa = 6.19ATDD105 pKa = 4.09LMAEE109 pKa = 4.35KK110 pKa = 9.01FTEE113 pKa = 4.39VGAHH117 pKa = 4.81VVDD120 pKa = 5.12SIVKK124 pKa = 9.77VDD126 pKa = 5.44LDD128 pKa = 3.72AQQADD133 pKa = 4.2VDD135 pKa = 4.1RR136 pKa = 11.84MQAMVNMFCDD146 pKa = 4.98AIDD149 pKa = 3.42QRR151 pKa = 11.84LEE153 pKa = 3.99DD154 pKa = 3.51SCAA157 pKa = 3.2
Molecular weight: 17.39 kDa
Isoelectric point according different methods:
Protein with the highest isoelectric point:
>tr|A0A3P5X1L9|A0A3P5X1L9_9BACL Uncharacterized protein OS=Filibacter tadaridae OX=2483811 GN=FILTAD_01828 PE=4 SV=1
MM1 pKa = 7.35KK2 pKa = 9.42RR3 pKa = 11.84TYY5 pKa = 10.34QPNKK9 pKa = 8.21RR10 pKa = 11.84KK11 pKa = 9.62RR12 pKa = 11.84SKK14 pKa = 9.83VHH16 pKa = 5.77GFRR19 pKa = 11.84ARR21 pKa = 11.84MSSKK25 pKa = 9.85SGRR28 pKa = 11.84RR29 pKa = 11.84VLAARR34 pKa = 11.84RR35 pKa = 11.84SKK37 pKa = 10.38GRR39 pKa = 11.84KK40 pKa = 8.51VLSAA44 pKa = 4.05
MM1 pKa = 7.35KK2 pKa = 9.42RR3 pKa = 11.84TYY5 pKa = 10.34QPNKK9 pKa = 8.21RR10 pKa = 11.84KK11 pKa = 9.62RR12 pKa = 11.84SKK14 pKa = 9.83VHH16 pKa = 5.77GFRR19 pKa = 11.84ARR21 pKa = 11.84MSSKK25 pKa = 9.85SGRR28 pKa = 11.84RR29 pKa = 11.84VLAARR34 pKa = 11.84RR35 pKa = 11.84SKK37 pKa = 10.38GRR39 pKa = 11.84KK40 pKa = 8.51VLSAA44 pKa = 4.05
Molecular weight: 5.13 kDa
Isoelectric point according different methods:
Peptides (in silico digests for buttom-up proteomics)
Below you can find in silico digests of the whole proteome with Trypsin, Chymotrypsin, Trypsin+LysC, LysN, ArgC proteases suitable for different mass spec machines.| Try ESI |
 |
|---|
| ChTry ESI |
 |
|---|
| ArgC ESI |
 |
|---|
| LysN ESI |
 |
|---|
| TryLysC ESI |
 |
|---|
| Try MALDI |
 |
|---|
| ChTry MALDI |
 |
|---|
| ArgC MALDI |
 |
|---|
| LysN MALDI |
 |
|---|
| TryLysC MALDI |
 |
|---|
| Try LTQ |
 |
|---|
| ChTry LTQ |
 |
|---|
| ArgC LTQ |
 |
|---|
| LysN LTQ |
 |
|---|
| TryLysC LTQ |
 |
|---|
| Try MSlow |
 |
|---|
| ChTry MSlow |
 |
|---|
| ArgC MSlow |
 |
|---|
| LysN MSlow |
 |
|---|
| TryLysC MSlow |
 |
|---|
| Try MShigh |
 |
|---|
| ChTry MShigh |
 |
|---|
| ArgC MShigh |
 |
|---|
| LysN MShigh |
 |
|---|
| TryLysC MShigh |
 |
|---|
General Statistics
Number of major isoforms |
Number of additional isoforms |
Number of all proteins |
Number of amino acids |
Min. Seq. Length |
Max. Seq. Length |
Avg. Seq. Length |
Avg. Mol. Weight |
|---|---|---|---|---|---|---|---|
0 |
876302 |
29 |
1637 |
288.4 |
32.21 |
Amino acid frequency
Ala |
Cys |
Asp |
Glu |
Phe |
Gly |
His |
Ile |
Lys |
Leu |
|---|---|---|---|---|---|---|---|---|---|
7.472 ± 0.048 | 0.622 ± 0.013 |
5.369 ± 0.037 | 7.45 ± 0.055 |
4.605 ± 0.036 | 7.123 ± 0.036 |
2.014 ± 0.021 | 7.752 ± 0.044 |
6.606 ± 0.039 | 9.616 ± 0.042 |
Met |
Asn |
Gln |
Pro |
Arg |
Ser |
Thr |
Val |
Trp |
Tyr |
|---|---|---|---|---|---|---|---|---|---|
2.988 ± 0.024 | 4.038 ± 0.032 |
3.628 ± 0.027 | 3.307 ± 0.029 |
4.236 ± 0.036 | 5.958 ± 0.032 |
5.782 ± 0.034 | 7.235 ± 0.042 |
0.959 ± 0.016 | 3.238 ± 0.027 |
Most of the basic statistics you can see at this page can be downloaded from this CSV file
Proteome-pI is available under Creative Commons Attribution-NoDerivs license, for more details see here
| Reference: Kozlowski LP. Proteome-pI 2.0: Proteome Isoelectric Point Database Update. Nucleic Acids Res. 2021, doi: 10.1093/nar/gkab944 | Contact: Lukasz P. Kozlowski |
