Bifidobacterium samirii
Taxonomy: cellular organisms; Bacteria; Terrabacteria group; Actinobacteria; Actinomycetia; Bifidobacteriales; Bifidobacteriaceae; Bifidobacterium
Average proteome isoelectric point is 5.88
Get precalculated fractions of proteins

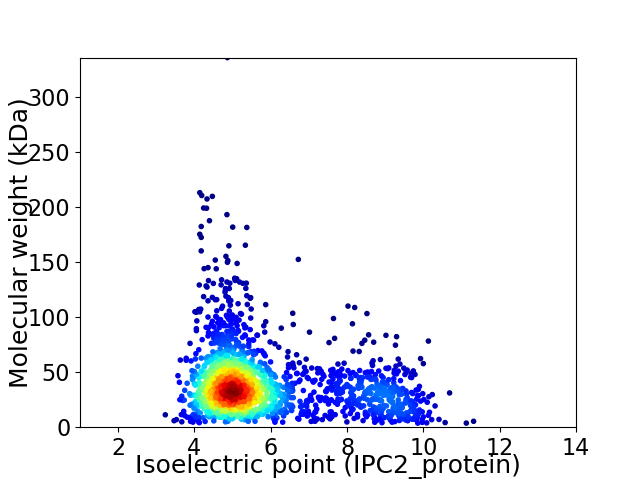
Virtual 2D-PAGE plot for 1965 proteins (isoelectric point calculated using IPC2_protein)
Get csv file with sequences according to given criteria:
* You can choose from 21 different methods for calculating isoelectric point
Summary statistics related to proteome-wise predictions


Protein with the lowest isoelectric point:
>tr|A0A430FF14|A0A430FF14_9BIFI DNA topoisomerase (ATP-hydrolyzing) OS=Bifidobacterium samirii OX=2306974 GN=D2E24_1911 PE=4 SV=1
MM1 pKa = 7.73SIHH4 pKa = 7.13DD5 pKa = 3.28HH6 pKa = 5.46HH7 pKa = 7.29QRR9 pKa = 11.84IRR11 pKa = 11.84EE12 pKa = 4.15TVRR15 pKa = 11.84TVSDD19 pKa = 3.52AAAQLARR26 pKa = 11.84RR27 pKa = 11.84RR28 pKa = 11.84VTAVTALVLALACVAAATLTYY49 pKa = 10.41GVVWPSFDD57 pKa = 5.11DD58 pKa = 4.62GASSAAAGAAEE69 pKa = 4.41APAASSADD77 pKa = 3.42GSSTATAAAQSDD89 pKa = 4.36DD90 pKa = 3.6EE91 pKa = 4.78SAVADD96 pKa = 4.45ASAASPVDD104 pKa = 3.45TSLAALDD111 pKa = 4.38DD112 pKa = 4.6LGGAAAVSTVGFDD125 pKa = 4.97LPDD128 pKa = 3.47EE129 pKa = 4.46SLAALQAEE137 pKa = 4.99LDD139 pKa = 3.78TFASYY144 pKa = 10.75GYY146 pKa = 8.71GASVALVDD154 pKa = 4.0VTTGAAISIDD164 pKa = 3.64GGTARR169 pKa = 11.84YY170 pKa = 8.59SASAIKK176 pKa = 10.68GPFVLSLAASGTIDD190 pKa = 3.86ADD192 pKa = 3.74AAVAAATYY200 pKa = 10.05EE201 pKa = 4.02DD202 pKa = 4.8DD203 pKa = 3.94YY204 pKa = 11.96VRR206 pKa = 11.84QLVEE210 pKa = 3.82ATVTVSDD217 pKa = 3.59NDD219 pKa = 3.49AYY221 pKa = 10.31ATLFEE226 pKa = 5.19TYY228 pKa = 9.11WSDD231 pKa = 5.91AIEE234 pKa = 3.82QWAAEE239 pKa = 4.28SSVTAPIAGAEE250 pKa = 4.05YY251 pKa = 10.91LDD253 pKa = 3.9ISAIDD258 pKa = 3.81MARR261 pKa = 11.84LWTMGYY267 pKa = 10.69GYY269 pKa = 10.97LFADD273 pKa = 4.66DD274 pKa = 5.48ADD276 pKa = 4.49AADD279 pKa = 4.25EE280 pKa = 4.38SADD283 pKa = 3.69GSSDD287 pKa = 3.36AAVVASASDD296 pKa = 3.59GAEE299 pKa = 3.93SGRR302 pKa = 11.84AWLADD307 pKa = 3.23AFSNTLNSSIHH318 pKa = 5.29MALVGGDD325 pKa = 4.1DD326 pKa = 4.6GSDD329 pKa = 2.93ASAAADD335 pKa = 3.59GAAAATSGTTVYY347 pKa = 10.42TKK349 pKa = 10.71AGWINGEE356 pKa = 3.96GGLYY360 pKa = 10.56ALNDD364 pKa = 3.66AGIVRR369 pKa = 11.84SASGDD374 pKa = 3.63YY375 pKa = 10.39ILAVMTDD382 pKa = 2.78ACGEE386 pKa = 4.16YY387 pKa = 11.06GLLTDD392 pKa = 6.58LITLLDD398 pKa = 4.44SIHH401 pKa = 6.77AEE403 pKa = 3.98SMAAA407 pKa = 3.82
MM1 pKa = 7.73SIHH4 pKa = 7.13DD5 pKa = 3.28HH6 pKa = 5.46HH7 pKa = 7.29QRR9 pKa = 11.84IRR11 pKa = 11.84EE12 pKa = 4.15TVRR15 pKa = 11.84TVSDD19 pKa = 3.52AAAQLARR26 pKa = 11.84RR27 pKa = 11.84RR28 pKa = 11.84VTAVTALVLALACVAAATLTYY49 pKa = 10.41GVVWPSFDD57 pKa = 5.11DD58 pKa = 4.62GASSAAAGAAEE69 pKa = 4.41APAASSADD77 pKa = 3.42GSSTATAAAQSDD89 pKa = 4.36DD90 pKa = 3.6EE91 pKa = 4.78SAVADD96 pKa = 4.45ASAASPVDD104 pKa = 3.45TSLAALDD111 pKa = 4.38DD112 pKa = 4.6LGGAAAVSTVGFDD125 pKa = 4.97LPDD128 pKa = 3.47EE129 pKa = 4.46SLAALQAEE137 pKa = 4.99LDD139 pKa = 3.78TFASYY144 pKa = 10.75GYY146 pKa = 8.71GASVALVDD154 pKa = 4.0VTTGAAISIDD164 pKa = 3.64GGTARR169 pKa = 11.84YY170 pKa = 8.59SASAIKK176 pKa = 10.68GPFVLSLAASGTIDD190 pKa = 3.86ADD192 pKa = 3.74AAVAAATYY200 pKa = 10.05EE201 pKa = 4.02DD202 pKa = 4.8DD203 pKa = 3.94YY204 pKa = 11.96VRR206 pKa = 11.84QLVEE210 pKa = 3.82ATVTVSDD217 pKa = 3.59NDD219 pKa = 3.49AYY221 pKa = 10.31ATLFEE226 pKa = 5.19TYY228 pKa = 9.11WSDD231 pKa = 5.91AIEE234 pKa = 3.82QWAAEE239 pKa = 4.28SSVTAPIAGAEE250 pKa = 4.05YY251 pKa = 10.91LDD253 pKa = 3.9ISAIDD258 pKa = 3.81MARR261 pKa = 11.84LWTMGYY267 pKa = 10.69GYY269 pKa = 10.97LFADD273 pKa = 4.66DD274 pKa = 5.48ADD276 pKa = 4.49AADD279 pKa = 4.25EE280 pKa = 4.38SADD283 pKa = 3.69GSSDD287 pKa = 3.36AAVVASASDD296 pKa = 3.59GAEE299 pKa = 3.93SGRR302 pKa = 11.84AWLADD307 pKa = 3.23AFSNTLNSSIHH318 pKa = 5.29MALVGGDD325 pKa = 4.1DD326 pKa = 4.6GSDD329 pKa = 2.93ASAAADD335 pKa = 3.59GAAAATSGTTVYY347 pKa = 10.42TKK349 pKa = 10.71AGWINGEE356 pKa = 3.96GGLYY360 pKa = 10.56ALNDD364 pKa = 3.66AGIVRR369 pKa = 11.84SASGDD374 pKa = 3.63YY375 pKa = 10.39ILAVMTDD382 pKa = 2.78ACGEE386 pKa = 4.16YY387 pKa = 11.06GLLTDD392 pKa = 6.58LITLLDD398 pKa = 4.44SIHH401 pKa = 6.77AEE403 pKa = 3.98SMAAA407 pKa = 3.82
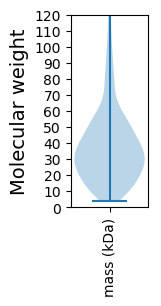
Molecular weight: 40.75 kDa
Isoelectric point according different methods:
Protein with the highest isoelectric point:
>tr|A0A430FV92|A0A430FV92_9BIFI Ribosomal RNA small subunit methyltransferase G OS=Bifidobacterium samirii OX=2306974 GN=rsmG PE=3 SV=1
MM1 pKa = 7.44KK2 pKa = 9.6RR3 pKa = 11.84TFQPNNRR10 pKa = 11.84RR11 pKa = 11.84RR12 pKa = 11.84HH13 pKa = 4.82MKK15 pKa = 9.64HH16 pKa = 5.7GFRR19 pKa = 11.84LRR21 pKa = 11.84MRR23 pKa = 11.84TRR25 pKa = 11.84SGRR28 pKa = 11.84AVINRR33 pKa = 11.84RR34 pKa = 11.84RR35 pKa = 11.84AKK37 pKa = 10.06GRR39 pKa = 11.84KK40 pKa = 8.87SLSAA44 pKa = 3.86
MM1 pKa = 7.44KK2 pKa = 9.6RR3 pKa = 11.84TFQPNNRR10 pKa = 11.84RR11 pKa = 11.84RR12 pKa = 11.84HH13 pKa = 4.82MKK15 pKa = 9.64HH16 pKa = 5.7GFRR19 pKa = 11.84LRR21 pKa = 11.84MRR23 pKa = 11.84TRR25 pKa = 11.84SGRR28 pKa = 11.84AVINRR33 pKa = 11.84RR34 pKa = 11.84RR35 pKa = 11.84AKK37 pKa = 10.06GRR39 pKa = 11.84KK40 pKa = 8.87SLSAA44 pKa = 3.86
Molecular weight: 5.38 kDa
Isoelectric point according different methods:
Peptides (in silico digests for buttom-up proteomics)
Below you can find in silico digests of the whole proteome with Trypsin, Chymotrypsin, Trypsin+LysC, LysN, ArgC proteases suitable for different mass spec machines.| Try ESI |
 |
|---|
| ChTry ESI |
 |
|---|
| ArgC ESI |
 |
|---|
| LysN ESI |
 |
|---|
| TryLysC ESI |
 |
|---|
| Try MALDI |
 |
|---|
| ChTry MALDI |
 |
|---|
| ArgC MALDI |
 |
|---|
| LysN MALDI |
 |
|---|
| TryLysC MALDI |
 |
|---|
| Try LTQ |
 |
|---|
| ChTry LTQ |
 |
|---|
| ArgC LTQ |
 |
|---|
| LysN LTQ |
 |
|---|
| TryLysC LTQ |
 |
|---|
| Try MSlow |
 |
|---|
| ChTry MSlow |
 |
|---|
| ArgC MSlow |
 |
|---|
| LysN MSlow |
 |
|---|
| TryLysC MSlow |
 |
|---|
| Try MShigh |
 |
|---|
| ChTry MShigh |
 |
|---|
| ArgC MShigh |
 |
|---|
| LysN MShigh |
 |
|---|
| TryLysC MShigh |
 |
|---|
General Statistics
Number of major isoforms |
Number of additional isoforms |
Number of all proteins |
Number of amino acids |
Min. Seq. Length |
Max. Seq. Length |
Avg. Seq. Length |
Avg. Mol. Weight |
|---|---|---|---|---|---|---|---|
0 |
737665 |
29 |
3195 |
375.4 |
40.74 |
Amino acid frequency
Ala |
Cys |
Asp |
Glu |
Phe |
Gly |
His |
Ile |
Lys |
Leu |
|---|---|---|---|---|---|---|---|---|---|
12.283 ± 0.083 | 0.947 ± 0.019 |
7.473 ± 0.062 | 5.441 ± 0.05 |
3.267 ± 0.035 | 8.465 ± 0.048 |
2.067 ± 0.026 | 4.839 ± 0.041 |
2.956 ± 0.053 | 8.585 ± 0.058 |
Met |
Asn |
Gln |
Pro |
Arg |
Ser |
Thr |
Val |
Trp |
Tyr |
|---|---|---|---|---|---|---|---|---|---|
2.623 ± 0.027 | 2.716 ± 0.037 |
4.81 ± 0.045 | 2.892 ± 0.036 |
6.909 ± 0.067 | 5.501 ± 0.044 |
6.225 ± 0.052 | 7.812 ± 0.054 |
1.421 ± 0.022 | 2.768 ± 0.031 |
Most of the basic statistics you can see at this page can be downloaded from this CSV file
Proteome-pI is available under Creative Commons Attribution-NoDerivs license, for more details see here
| Reference: Kozlowski LP. Proteome-pI 2.0: Proteome Isoelectric Point Database Update. Nucleic Acids Res. 2021, doi: 10.1093/nar/gkab944 | Contact: Lukasz P. Kozlowski |
