Slackia isoflavoniconvertens
Taxonomy: cellular organisms; Bacteria; Terrabacteria group; Actinobacteria; Coriobacteriia; Eggerthellales; Eggerthellaceae; Slackia
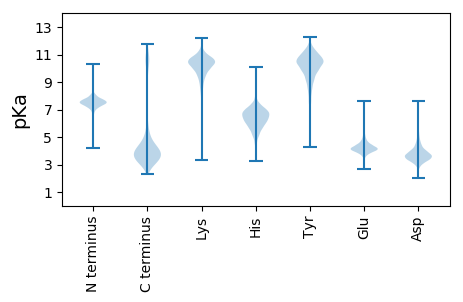
Average proteome isoelectric point is 5.8
Get precalculated fractions of proteins

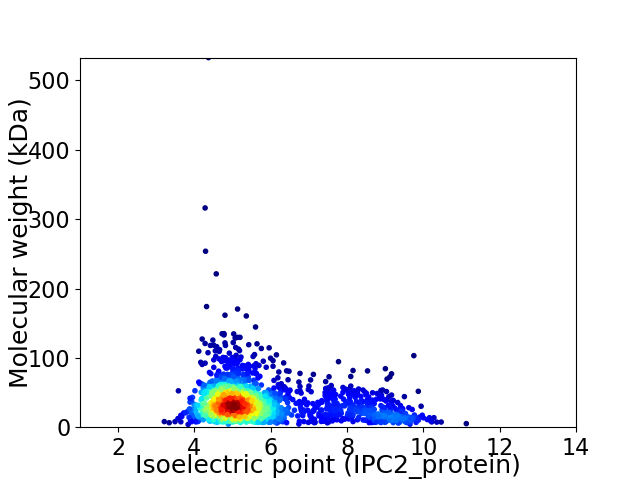
Virtual 2D-PAGE plot for 1842 proteins (isoelectric point calculated using IPC2_protein)
Get csv file with sequences according to given criteria:
* You can choose from 21 different methods for calculating isoelectric point
Summary statistics related to proteome-wise predictions


Protein with the lowest isoelectric point:
>tr|A0A3N0IKJ9|A0A3N0IKJ9_9ACTN Laccase domain-containing protein OS=Slackia isoflavoniconvertens OX=572010 GN=DMP05_00785 PE=3 SV=1
MM1 pKa = 7.89AEE3 pKa = 4.27DD4 pKa = 4.07HH5 pKa = 6.96TNQQPQQPPQPAEE18 pKa = 3.75PQGFDD23 pKa = 3.16AQQSQAYY30 pKa = 9.25AQGQAQPFAQSQPYY44 pKa = 9.44GQAQAQQPYY53 pKa = 8.57GQPGAHH59 pKa = 6.17QYY61 pKa = 9.35AQPGCGQQYY70 pKa = 8.55YY71 pKa = 10.52APAAQPVYY79 pKa = 10.33AAPASRR85 pKa = 11.84KK86 pKa = 10.17KK87 pKa = 10.9NMTPWIVLGVILFAVVFCFTIGAMSCSSAVRR118 pKa = 11.84SLSNFGMGSVEE129 pKa = 4.56EE130 pKa = 4.47EE131 pKa = 4.26LTDD134 pKa = 4.16GPTVAVIDD142 pKa = 3.59ISGTIQYY149 pKa = 10.52DD150 pKa = 3.61GTACSPEE157 pKa = 4.22GLSSLLNQAEE167 pKa = 4.2EE168 pKa = 4.14NDD170 pKa = 4.31DD171 pKa = 3.54IEE173 pKa = 5.03AVVLRR178 pKa = 11.84VDD180 pKa = 3.68SGGGTATAGEE190 pKa = 4.23EE191 pKa = 3.52MAEE194 pKa = 4.08YY195 pKa = 10.52VKK197 pKa = 10.63RR198 pKa = 11.84FSKK201 pKa = 10.57PVVVSSASMNCSAAYY216 pKa = 9.24EE217 pKa = 4.16ISSQADD223 pKa = 4.13LIYY226 pKa = 11.03VNKK229 pKa = 8.02TTDD232 pKa = 2.49IGAIGTVMQVTDD244 pKa = 4.74LSEE247 pKa = 4.87LLDD250 pKa = 3.7KK251 pKa = 11.43LGISVDD257 pKa = 4.01NIASAEE263 pKa = 4.37SKK265 pKa = 10.42DD266 pKa = 3.43SSYY269 pKa = 10.19GTRR272 pKa = 11.84PLTDD276 pKa = 3.21EE277 pKa = 3.65EE278 pKa = 3.88RR279 pKa = 11.84AYY281 pKa = 10.39YY282 pKa = 9.96QEE284 pKa = 5.68LIDD287 pKa = 3.64VTNEE291 pKa = 3.63VFVEE295 pKa = 4.52NVAEE299 pKa = 4.3GRR301 pKa = 11.84SMSLDD306 pKa = 3.34EE307 pKa = 4.91ARR309 pKa = 11.84ALATGLSFTGEE320 pKa = 3.9QAVEE324 pKa = 3.85NGLADD329 pKa = 3.71EE330 pKa = 4.81VGVFDD335 pKa = 5.87DD336 pKa = 5.48AIEE339 pKa = 4.33AAAQLAGLGSDD350 pKa = 3.82YY351 pKa = 11.56NVITLTQSSDD361 pKa = 3.13LGSLMDD367 pKa = 5.33LLSEE371 pKa = 4.41SDD373 pKa = 3.53SDD375 pKa = 4.24SATSAAAAKK384 pKa = 10.38LIEE387 pKa = 4.07LLKK390 pKa = 11.16NEE392 pKa = 4.46GVLSS396 pKa = 3.83
MM1 pKa = 7.89AEE3 pKa = 4.27DD4 pKa = 4.07HH5 pKa = 6.96TNQQPQQPPQPAEE18 pKa = 3.75PQGFDD23 pKa = 3.16AQQSQAYY30 pKa = 9.25AQGQAQPFAQSQPYY44 pKa = 9.44GQAQAQQPYY53 pKa = 8.57GQPGAHH59 pKa = 6.17QYY61 pKa = 9.35AQPGCGQQYY70 pKa = 8.55YY71 pKa = 10.52APAAQPVYY79 pKa = 10.33AAPASRR85 pKa = 11.84KK86 pKa = 10.17KK87 pKa = 10.9NMTPWIVLGVILFAVVFCFTIGAMSCSSAVRR118 pKa = 11.84SLSNFGMGSVEE129 pKa = 4.56EE130 pKa = 4.47EE131 pKa = 4.26LTDD134 pKa = 4.16GPTVAVIDD142 pKa = 3.59ISGTIQYY149 pKa = 10.52DD150 pKa = 3.61GTACSPEE157 pKa = 4.22GLSSLLNQAEE167 pKa = 4.2EE168 pKa = 4.14NDD170 pKa = 4.31DD171 pKa = 3.54IEE173 pKa = 5.03AVVLRR178 pKa = 11.84VDD180 pKa = 3.68SGGGTATAGEE190 pKa = 4.23EE191 pKa = 3.52MAEE194 pKa = 4.08YY195 pKa = 10.52VKK197 pKa = 10.63RR198 pKa = 11.84FSKK201 pKa = 10.57PVVVSSASMNCSAAYY216 pKa = 9.24EE217 pKa = 4.16ISSQADD223 pKa = 4.13LIYY226 pKa = 11.03VNKK229 pKa = 8.02TTDD232 pKa = 2.49IGAIGTVMQVTDD244 pKa = 4.74LSEE247 pKa = 4.87LLDD250 pKa = 3.7KK251 pKa = 11.43LGISVDD257 pKa = 4.01NIASAEE263 pKa = 4.37SKK265 pKa = 10.42DD266 pKa = 3.43SSYY269 pKa = 10.19GTRR272 pKa = 11.84PLTDD276 pKa = 3.21EE277 pKa = 3.65EE278 pKa = 3.88RR279 pKa = 11.84AYY281 pKa = 10.39YY282 pKa = 9.96QEE284 pKa = 5.68LIDD287 pKa = 3.64VTNEE291 pKa = 3.63VFVEE295 pKa = 4.52NVAEE299 pKa = 4.3GRR301 pKa = 11.84SMSLDD306 pKa = 3.34EE307 pKa = 4.91ARR309 pKa = 11.84ALATGLSFTGEE320 pKa = 3.9QAVEE324 pKa = 3.85NGLADD329 pKa = 3.71EE330 pKa = 4.81VGVFDD335 pKa = 5.87DD336 pKa = 5.48AIEE339 pKa = 4.33AAAQLAGLGSDD350 pKa = 3.82YY351 pKa = 11.56NVITLTQSSDD361 pKa = 3.13LGSLMDD367 pKa = 5.33LLSEE371 pKa = 4.41SDD373 pKa = 3.53SDD375 pKa = 4.24SATSAAAAKK384 pKa = 10.38LIEE387 pKa = 4.07LLKK390 pKa = 11.16NEE392 pKa = 4.46GVLSS396 pKa = 3.83
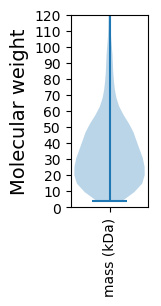
Molecular weight: 41.7 kDa
Isoelectric point according different methods:
Protein with the highest isoelectric point:
>tr|A0A369LL14|A0A369LL14_9ACTN Protein RecA OS=Slackia isoflavoniconvertens OX=572010 GN=recA PE=3 SV=1
MM1 pKa = 7.35KK2 pKa = 9.43RR3 pKa = 11.84TYY5 pKa = 10.35QPNNRR10 pKa = 11.84KK11 pKa = 8.98RR12 pKa = 11.84AKK14 pKa = 8.49THH16 pKa = 5.22GFRR19 pKa = 11.84ARR21 pKa = 11.84MATKK25 pKa = 10.27GGRR28 pKa = 11.84AVLARR33 pKa = 11.84RR34 pKa = 11.84RR35 pKa = 11.84AKK37 pKa = 9.73GRR39 pKa = 11.84KK40 pKa = 8.88RR41 pKa = 11.84LTVV44 pKa = 3.11
MM1 pKa = 7.35KK2 pKa = 9.43RR3 pKa = 11.84TYY5 pKa = 10.35QPNNRR10 pKa = 11.84KK11 pKa = 8.98RR12 pKa = 11.84AKK14 pKa = 8.49THH16 pKa = 5.22GFRR19 pKa = 11.84ARR21 pKa = 11.84MATKK25 pKa = 10.27GGRR28 pKa = 11.84AVLARR33 pKa = 11.84RR34 pKa = 11.84RR35 pKa = 11.84AKK37 pKa = 9.73GRR39 pKa = 11.84KK40 pKa = 8.88RR41 pKa = 11.84LTVV44 pKa = 3.11
Molecular weight: 5.15 kDa
Isoelectric point according different methods:
Peptides (in silico digests for buttom-up proteomics)
Below you can find in silico digests of the whole proteome with Trypsin, Chymotrypsin, Trypsin+LysC, LysN, ArgC proteases suitable for different mass spec machines.| Try ESI |
 |
|---|
| ChTry ESI |
 |
|---|
| ArgC ESI |
 |
|---|
| LysN ESI |
 |
|---|
| TryLysC ESI |
 |
|---|
| Try MALDI |
 |
|---|
| ChTry MALDI |
 |
|---|
| ArgC MALDI |
 |
|---|
| LysN MALDI |
 |
|---|
| TryLysC MALDI |
 |
|---|
| Try LTQ |
 |
|---|
| ChTry LTQ |
 |
|---|
| ArgC LTQ |
 |
|---|
| LysN LTQ |
 |
|---|
| TryLysC LTQ |
 |
|---|
| Try MSlow |
 |
|---|
| ChTry MSlow |
 |
|---|
| ArgC MSlow |
 |
|---|
| LysN MSlow |
 |
|---|
| TryLysC MSlow |
 |
|---|
| Try MShigh |
 |
|---|
| ChTry MShigh |
 |
|---|
| ArgC MShigh |
 |
|---|
| LysN MShigh |
 |
|---|
| TryLysC MShigh |
 |
|---|
General Statistics
Number of major isoforms |
Number of additional isoforms |
Number of all proteins |
Number of amino acids |
Min. Seq. Length |
Max. Seq. Length |
Avg. Seq. Length |
Avg. Mol. Weight |
|---|---|---|---|---|---|---|---|
0 |
628285 |
37 |
5068 |
341.1 |
37.08 |
Amino acid frequency
Ala |
Cys |
Asp |
Glu |
Phe |
Gly |
His |
Ile |
Lys |
Leu |
|---|---|---|---|---|---|---|---|---|---|
11.74 ± 0.089 | 1.696 ± 0.027 |
6.018 ± 0.047 | 6.814 ± 0.053 |
3.906 ± 0.042 | 8.124 ± 0.053 |
1.896 ± 0.025 | 5.364 ± 0.043 |
4.411 ± 0.047 | 8.508 ± 0.062 |
Met |
Asn |
Gln |
Pro |
Arg |
Ser |
Thr |
Val |
Trp |
Tyr |
|---|---|---|---|---|---|---|---|---|---|
2.767 ± 0.03 | 3.216 ± 0.043 |
4.07 ± 0.032 | 2.868 ± 0.03 |
5.529 ± 0.081 | 6.101 ± 0.05 |
5.201 ± 0.07 | 7.941 ± 0.055 |
1.034 ± 0.02 | 2.798 ± 0.037 |
Most of the basic statistics you can see at this page can be downloaded from this CSV file
Proteome-pI is available under Creative Commons Attribution-NoDerivs license, for more details see here
| Reference: Kozlowski LP. Proteome-pI 2.0: Proteome Isoelectric Point Database Update. Nucleic Acids Res. 2021, doi: 10.1093/nar/gkab944 | Contact: Lukasz P. Kozlowski |
