Verrucomicrobiales bacterium VVV1
Taxonomy: cellular organisms; Bacteria; PVC group; Verrucomicrobia; Verrucomicrobiae; Verrucomicrobiales; unclassified Verrucomicrobiales
Average proteome isoelectric point is 6.66
Get precalculated fractions of proteins

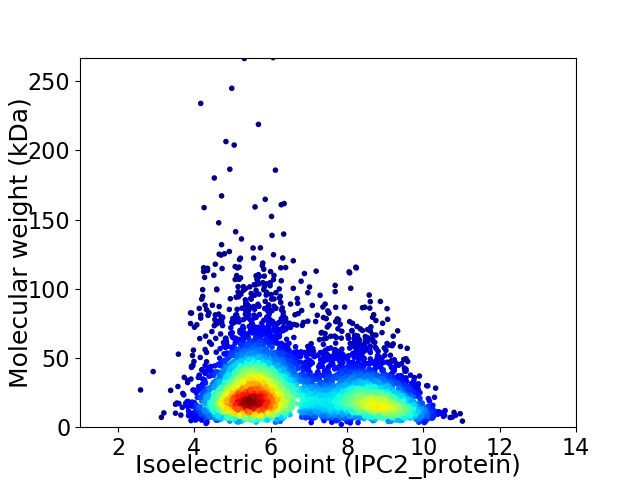
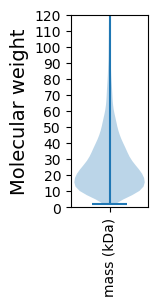
Virtual 2D-PAGE plot for 5352 proteins (isoelectric point calculated using IPC2_protein)
Get csv file with sequences according to given criteria:
* You can choose from 21 different methods for calculating isoelectric point
Summary statistics related to proteome-wise predictions


Protein with the lowest isoelectric point:
>tr|A0A257LYI8|A0A257LYI8_9BACT Glucose-6-phosphate isomerase OS=Verrucomicrobiales bacterium VVV1 OX=2015575 GN=pgi PE=3 SV=1
EEE2 pKa = 4.13FATTDDD8 pKa = 2.74SGNYYY13 pKa = 9.35ISGLIAGTYYY23 pKa = 8.05VVVDDD28 pKa = 4.29TSLPAGVTVTGDDD41 pKa = 3.41DDD43 pKa = 3.5TKKK46 pKa = 10.64DD47 pKa = 3.19KKK49 pKa = 7.93TVTLTAAQALTTANFGYYY67 pKa = 10.17GNASFGDDD75 pKa = 4.25YY76 pKa = 9.82WNDDD80 pKa = 3.31NGDDD84 pKa = 4.22VQDDD88 pKa = 3.75TDDD91 pKa = 4.05PLSGVRR97 pKa = 11.84VFIDDD102 pKa = 3.62NANGTRR108 pKa = 11.84EEE110 pKa = 4.16NEEE113 pKa = 3.81FATTNASGAYYY124 pKa = 10.43MTGLAAGSYYY134 pKa = 8.52VAVDDD139 pKa = 3.57TSLPSGASQTGDDD152 pKa = 3.24DDD154 pKa = 3.58TKKK157 pKa = 10.79DD158 pKa = 3.03RR159 pKa = 11.84TAVTLTSGQALTTADDD175 pKa = 4.12GYYY178 pKa = 10.46GNASVGDDD186 pKa = 4.16YY187 pKa = 10.31WNDDD191 pKa = 3.03NGDDD195 pKa = 3.83GQGATEEE202 pKa = 4.25PMSGIRR208 pKa = 11.84VFIDDD213 pKa = 3.44NANGSRR219 pKa = 11.84DDD221 pKa = 3.67NEEE224 pKa = 4.23FATTNASGAYYY235 pKa = 7.99ISGLTPGTYYY245 pKa = 8.81VAVDDD250 pKa = 3.58TTLPSGTTNTGDDD263 pKa = 3.71DDD265 pKa = 3.61TKKK268 pKa = 10.63DD269 pKa = 3.15KKK271 pKa = 9.64SVTLAAGVPNTTSDDD286 pKa = 3.98GYYY289 pKa = 10.04GNGAISAIVFLDDD302 pKa = 3.58DDD304 pKa = 3.39SGAQTSGEEE313 pKa = 4.03GISGVTVFLDDD324 pKa = 3.65YY325 pKa = 11.42GDDD328 pKa = 4.16IRR330 pKa = 11.84QTNEEE335 pKa = 3.53QTTTSSTGAYYY346 pKa = 9.45FTGLIPGNYYY356 pKa = 8.62VVVVSATLPAGVTQTADDD374 pKa = 3.31DDD376 pKa = 3.72TMDDD380 pKa = 3.17KKK382 pKa = 8.58TVAVTAGATNTTPNFGYYY400 pKa = 10.22GNASIGDDD408 pKa = 4.17YY409 pKa = 10.91WIDDD413 pKa = 3.06DDD415 pKa = 4.36NGTQDDD421 pKa = 3.23TEEE424 pKa = 4.44PLGGVVVYYY433 pKa = 10.95DDD435 pKa = 4.21NSNGTRR441 pKa = 11.84EEE443 pKa = 4.29NEEE446 pKa = 3.5FATTNSSGSYYY457 pKa = 8.91INGLTPGTYYY467 pKa = 10.24VTVDDD472 pKa = 5.25STLPAGSTNTGDDD485 pKa = 3.84DDD487 pKa = 3.33TKKK490 pKa = 10.58DD491 pKa = 3.4KKK493 pKa = 9.55SVTLASAQSLTTADDD508 pKa = 3.62GYYY511 pKa = 10.53GVGSIGSSIWN
EEE2 pKa = 4.13FATTDDD8 pKa = 2.74SGNYYY13 pKa = 9.35ISGLIAGTYYY23 pKa = 8.05VVVDDD28 pKa = 4.29TSLPAGVTVTGDDD41 pKa = 3.41DDD43 pKa = 3.5TKKK46 pKa = 10.64DD47 pKa = 3.19KKK49 pKa = 7.93TVTLTAAQALTTANFGYYY67 pKa = 10.17GNASFGDDD75 pKa = 4.25YY76 pKa = 9.82WNDDD80 pKa = 3.31NGDDD84 pKa = 4.22VQDDD88 pKa = 3.75TDDD91 pKa = 4.05PLSGVRR97 pKa = 11.84VFIDDD102 pKa = 3.62NANGTRR108 pKa = 11.84EEE110 pKa = 4.16NEEE113 pKa = 3.81FATTNASGAYYY124 pKa = 10.43MTGLAAGSYYY134 pKa = 8.52VAVDDD139 pKa = 3.57TSLPSGASQTGDDD152 pKa = 3.24DDD154 pKa = 3.58TKKK157 pKa = 10.79DD158 pKa = 3.03RR159 pKa = 11.84TAVTLTSGQALTTADDD175 pKa = 4.12GYYY178 pKa = 10.46GNASVGDDD186 pKa = 4.16YY187 pKa = 10.31WNDDD191 pKa = 3.03NGDDD195 pKa = 3.83GQGATEEE202 pKa = 4.25PMSGIRR208 pKa = 11.84VFIDDD213 pKa = 3.44NANGSRR219 pKa = 11.84DDD221 pKa = 3.67NEEE224 pKa = 4.23FATTNASGAYYY235 pKa = 7.99ISGLTPGTYYY245 pKa = 8.81VAVDDD250 pKa = 3.58TTLPSGTTNTGDDD263 pKa = 3.71DDD265 pKa = 3.61TKKK268 pKa = 10.63DD269 pKa = 3.15KKK271 pKa = 9.64SVTLAAGVPNTTSDDD286 pKa = 3.98GYYY289 pKa = 10.04GNGAISAIVFLDDD302 pKa = 3.58DDD304 pKa = 3.39SGAQTSGEEE313 pKa = 4.03GISGVTVFLDDD324 pKa = 3.65YY325 pKa = 11.42GDDD328 pKa = 4.16IRR330 pKa = 11.84QTNEEE335 pKa = 3.53QTTTSSTGAYYY346 pKa = 9.45FTGLIPGNYYY356 pKa = 8.62VVVVSATLPAGVTQTADDD374 pKa = 3.31DDD376 pKa = 3.72TMDDD380 pKa = 3.17KKK382 pKa = 8.58TVAVTAGATNTTPNFGYYY400 pKa = 10.22GNASIGDDD408 pKa = 4.17YY409 pKa = 10.91WIDDD413 pKa = 3.06DDD415 pKa = 4.36NGTQDDD421 pKa = 3.23TEEE424 pKa = 4.44PLGGVVVYYY433 pKa = 10.95DDD435 pKa = 4.21NSNGTRR441 pKa = 11.84EEE443 pKa = 4.29NEEE446 pKa = 3.5FATTNSSGSYYY457 pKa = 8.91INGLTPGTYYY467 pKa = 10.24VTVDDD472 pKa = 5.25STLPAGSTNTGDDD485 pKa = 3.84DDD487 pKa = 3.33TKKK490 pKa = 10.58DD491 pKa = 3.4KKK493 pKa = 9.55SVTLASAQSLTTADDD508 pKa = 3.62GYYY511 pKa = 10.53GVGSIGSSIWN
Molecular weight: 52.77 kDa
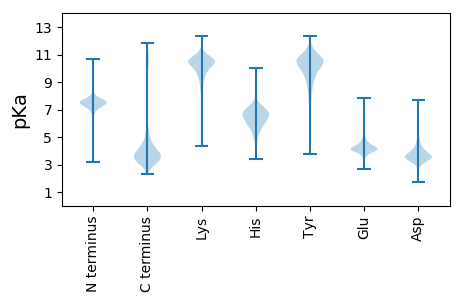
Isoelectric point according different methods:
Protein with the highest isoelectric point:
>tr|A0A257LEN3|A0A257LEN3_9BACT MFS transporter (Fragment) OS=Verrucomicrobiales bacterium VVV1 OX=2015575 GN=CFE26_28175 PE=4 SV=1
MM1 pKa = 7.66PPSSSRR7 pKa = 11.84PSKK10 pKa = 8.99PAKK13 pKa = 9.46RR14 pKa = 11.84ANSSRR19 pKa = 11.84KK20 pKa = 7.19TPSASSSATNGPSPPRR36 pKa = 11.84SSSSSSASGANSPSAPNPASSALHH60 pKa = 6.01ALRR63 pKa = 11.84SRR65 pKa = 11.84RR66 pKa = 11.84LPRR69 pKa = 11.84PPCPRR74 pKa = 11.84PPQPNRR80 pKa = 11.84PPPPPP85 pKa = 4.13
MM1 pKa = 7.66PPSSSRR7 pKa = 11.84PSKK10 pKa = 8.99PAKK13 pKa = 9.46RR14 pKa = 11.84ANSSRR19 pKa = 11.84KK20 pKa = 7.19TPSASSSATNGPSPPRR36 pKa = 11.84SSSSSSASGANSPSAPNPASSALHH60 pKa = 6.01ALRR63 pKa = 11.84SRR65 pKa = 11.84RR66 pKa = 11.84LPRR69 pKa = 11.84PPCPRR74 pKa = 11.84PPQPNRR80 pKa = 11.84PPPPPP85 pKa = 4.13
Molecular weight: 8.64 kDa
Isoelectric point according different methods:
Peptides (in silico digests for buttom-up proteomics)
Below you can find in silico digests of the whole proteome with Trypsin, Chymotrypsin, Trypsin+LysC, LysN, ArgC proteases suitable for different mass spec machines.| Try ESI |
 |
|---|
| ChTry ESI |
 |
|---|
| ArgC ESI |
 |
|---|
| LysN ESI |
 |
|---|
| TryLysC ESI |
 |
|---|
| Try MALDI |
 |
|---|
| ChTry MALDI |
 |
|---|
| ArgC MALDI |
 |
|---|
| LysN MALDI |
 |
|---|
| TryLysC MALDI |
 |
|---|
| Try LTQ |
 |
|---|
| ChTry LTQ |
 |
|---|
| ArgC LTQ |
 |
|---|
| LysN LTQ |
 |
|---|
| TryLysC LTQ |
 |
|---|
| Try MSlow |
 |
|---|
| ChTry MSlow |
 |
|---|
| ArgC MSlow |
 |
|---|
| LysN MSlow |
 |
|---|
| TryLysC MSlow |
 |
|---|
| Try MShigh |
 |
|---|
| ChTry MShigh |
 |
|---|
| ArgC MShigh |
 |
|---|
| LysN MShigh |
 |
|---|
| TryLysC MShigh |
 |
|---|
General Statistics
Number of major isoforms |
Number of additional isoforms |
Number of all proteins |
Number of amino acids |
Min. Seq. Length |
Max. Seq. Length |
Avg. Seq. Length |
Avg. Mol. Weight |
|---|---|---|---|---|---|---|---|
0 |
1447052 |
20 |
2552 |
270.4 |
29.43 |
Amino acid frequency
Ala |
Cys |
Asp |
Glu |
Phe |
Gly |
His |
Ile |
Lys |
Leu |
|---|---|---|---|---|---|---|---|---|---|
10.543 ± 0.038 | 0.927 ± 0.012 |
5.348 ± 0.025 | 5.713 ± 0.047 |
4.004 ± 0.023 | 8.618 ± 0.05 |
2.051 ± 0.02 | 4.906 ± 0.025 |
4.352 ± 0.041 | 10.046 ± 0.034 |
Met |
Asn |
Gln |
Pro |
Arg |
Ser |
Thr |
Val |
Trp |
Tyr |
|---|---|---|---|---|---|---|---|---|---|
2.071 ± 0.019 | 3.351 ± 0.035 |
5.396 ± 0.028 | 3.122 ± 0.019 |
6.072 ± 0.04 | 6.661 ± 0.039 |
6.245 ± 0.062 | 6.741 ± 0.031 |
1.589 ± 0.015 | 2.24 ± 0.016 |
Most of the basic statistics you can see at this page can be downloaded from this CSV file
Proteome-pI is available under Creative Commons Attribution-NoDerivs license, for more details see here
| Reference: Kozlowski LP. Proteome-pI 2.0: Proteome Isoelectric Point Database Update. Nucleic Acids Res. 2021, doi: 10.1093/nar/gkab944 | Contact: Lukasz P. Kozlowski |
