Aspergillus novofumigatus IBT 16806
Taxonomy: cellular organisms; Eukaryota; Opisthokonta; Fungi; Dikarya; Ascomycota; saccharomyceta; Pezizomycotina; leotiomyceta; Eurotiomycetes; Eurotiomycetidae; Eurotiales; Aspergillaceae; Aspergillus; Aspergillus novofumigatus
Average proteome isoelectric point is 6.58
Get precalculated fractions of proteins

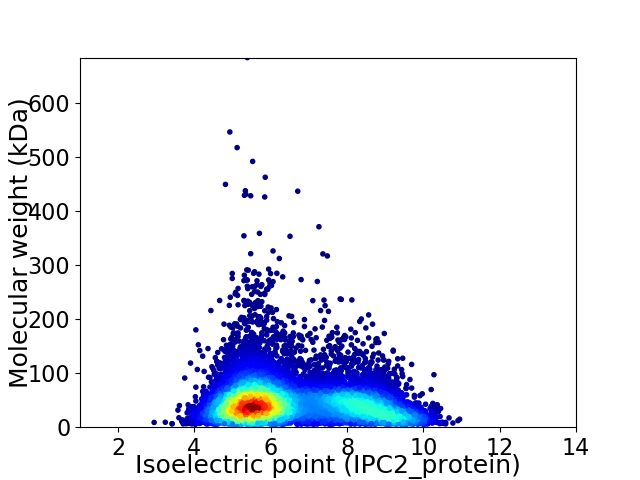
Virtual 2D-PAGE plot for 11480 proteins (isoelectric point calculated using IPC2_protein)
Get csv file with sequences according to given criteria:
* You can choose from 21 different methods for calculating isoelectric point
Summary statistics related to proteome-wise predictions


Protein with the lowest isoelectric point:
>tr|A0A2I1CC97|A0A2I1CC97_ASPN1 Uncharacterized protein OS=Aspergillus novofumigatus (strain IBT 16806) OX=1392255 GN=P174DRAFT_129096 PE=4 SV=1
MM1 pKa = 7.39HH2 pKa = 7.57LALSLLALSATSTLAAPVNTLSQNQDD28 pKa = 2.64SNAPTRR34 pKa = 11.84AARR37 pKa = 11.84LLTPISHH44 pKa = 7.05PSKK47 pKa = 10.95DD48 pKa = 3.63EE49 pKa = 3.92SHH51 pKa = 6.67LKK53 pKa = 10.65ARR55 pKa = 11.84TFGLLSGLLSHH66 pKa = 6.81GFGGSGSAEE75 pKa = 3.9CEE77 pKa = 3.97ACEE80 pKa = 4.45GEE82 pKa = 4.38AGGSAGASGGLGGLLSGGLGGHH104 pKa = 7.4LGGGLGGHH112 pKa = 7.38LGGGLGLGGSAGAGEE127 pKa = 4.8DD128 pKa = 3.63CDD130 pKa = 4.19EE131 pKa = 4.55NGEE134 pKa = 4.39GGVSAGGSAGGSAGGSAGGSGEE156 pKa = 3.98GSAGGSAGGSAGGSVGGSAGGSAGGSAGGSASGSAGGDD194 pKa = 3.15TGASATGSGSAGGSAGGSAGGSATGSLGGSASGTAGGSLGGSAGGSAGGSAGGSASGSAGGDD256 pKa = 3.15TGASATGSGSTGGSATGSGGSASGSAGGDD285 pKa = 3.14TGASTTGSGSGSGSTGGSATGSVGGSGSVGGSAGGSAGGSAGGDD329 pKa = 3.09AGSSTTGSGSGSTEE343 pKa = 3.8GSGSTGGSASGSAGGDD359 pKa = 3.27TGASAPGSGSGSTEE373 pKa = 3.71GSGSGSGSGSVGGSAGGSAGGSGSSSGGISIGGSATGSGGASASATASASAGATASAGASATGGSGSDD441 pKa = 3.23NGEE444 pKa = 4.31DD445 pKa = 4.06CDD447 pKa = 4.11EE448 pKa = 4.57TGADD452 pKa = 3.83ATTGDD457 pKa = 3.78NGDD460 pKa = 4.94DD461 pKa = 3.86YY462 pKa = 11.82GDD464 pKa = 4.12DD465 pKa = 3.8AGEE468 pKa = 4.73GDD470 pKa = 4.63DD471 pKa = 5.0SSAGGDD477 pKa = 3.52DD478 pKa = 6.28SEE480 pKa = 6.76DD481 pKa = 3.84CDD483 pKa = 5.05CDD485 pKa = 3.39QQ486 pKa = 5.07
MM1 pKa = 7.39HH2 pKa = 7.57LALSLLALSATSTLAAPVNTLSQNQDD28 pKa = 2.64SNAPTRR34 pKa = 11.84AARR37 pKa = 11.84LLTPISHH44 pKa = 7.05PSKK47 pKa = 10.95DD48 pKa = 3.63EE49 pKa = 3.92SHH51 pKa = 6.67LKK53 pKa = 10.65ARR55 pKa = 11.84TFGLLSGLLSHH66 pKa = 6.81GFGGSGSAEE75 pKa = 3.9CEE77 pKa = 3.97ACEE80 pKa = 4.45GEE82 pKa = 4.38AGGSAGASGGLGGLLSGGLGGHH104 pKa = 7.4LGGGLGGHH112 pKa = 7.38LGGGLGLGGSAGAGEE127 pKa = 4.8DD128 pKa = 3.63CDD130 pKa = 4.19EE131 pKa = 4.55NGEE134 pKa = 4.39GGVSAGGSAGGSAGGSAGGSGEE156 pKa = 3.98GSAGGSAGGSAGGSVGGSAGGSAGGSAGGSASGSAGGDD194 pKa = 3.15TGASATGSGSAGGSAGGSAGGSATGSLGGSASGTAGGSLGGSAGGSAGGSAGGSASGSAGGDD256 pKa = 3.15TGASATGSGSTGGSATGSGGSASGSAGGDD285 pKa = 3.14TGASTTGSGSGSGSTGGSATGSVGGSGSVGGSAGGSAGGSAGGDD329 pKa = 3.09AGSSTTGSGSGSTEE343 pKa = 3.8GSGSTGGSASGSAGGDD359 pKa = 3.27TGASAPGSGSGSTEE373 pKa = 3.71GSGSGSGSGSVGGSAGGSAGGSGSSSGGISIGGSATGSGGASASATASASAGATASAGASATGGSGSDD441 pKa = 3.23NGEE444 pKa = 4.31DD445 pKa = 4.06CDD447 pKa = 4.11EE448 pKa = 4.57TGADD452 pKa = 3.83ATTGDD457 pKa = 3.78NGDD460 pKa = 4.94DD461 pKa = 3.86YY462 pKa = 11.82GDD464 pKa = 4.12DD465 pKa = 3.8AGEE468 pKa = 4.73GDD470 pKa = 4.63DD471 pKa = 5.0SSAGGDD477 pKa = 3.52DD478 pKa = 6.28SEE480 pKa = 6.76DD481 pKa = 3.84CDD483 pKa = 5.05CDD485 pKa = 3.39QQ486 pKa = 5.07
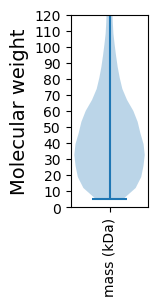
Molecular weight: 40.04 kDa
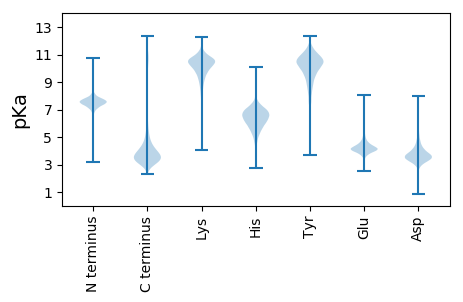
Isoelectric point according different methods:
Protein with the highest isoelectric point:
>tr|A0A2I1C6A8|A0A2I1C6A8_ASPN1 Putative UBX domain protein OS=Aspergillus novofumigatus (strain IBT 16806) OX=1392255 GN=P174DRAFT_391806 PE=4 SV=1
MM1 pKa = 7.8LCFQCRR7 pKa = 11.84AVPSALRR14 pKa = 11.84TAMRR18 pKa = 11.84SQPFSRR24 pKa = 11.84LPTQTFTTSLSTPLRR39 pKa = 11.84TFSSALRR46 pKa = 11.84SQPTPLTQSLPSFRR60 pKa = 11.84TSLTPVSSLSFGLTQQTRR78 pKa = 11.84SFSASASLAGKK89 pKa = 9.59RR90 pKa = 11.84ATYY93 pKa = 10.03NPSRR97 pKa = 11.84RR98 pKa = 11.84VQKK101 pKa = 10.2RR102 pKa = 11.84RR103 pKa = 11.84HH104 pKa = 5.33GFLARR109 pKa = 11.84LRR111 pKa = 11.84SRR113 pKa = 11.84GGRR116 pKa = 11.84KK117 pKa = 8.87VLQHH121 pKa = 6.19RR122 pKa = 11.84RR123 pKa = 11.84AKK125 pKa = 9.96GRR127 pKa = 11.84KK128 pKa = 7.78SLSWW132 pKa = 3.4
MM1 pKa = 7.8LCFQCRR7 pKa = 11.84AVPSALRR14 pKa = 11.84TAMRR18 pKa = 11.84SQPFSRR24 pKa = 11.84LPTQTFTTSLSTPLRR39 pKa = 11.84TFSSALRR46 pKa = 11.84SQPTPLTQSLPSFRR60 pKa = 11.84TSLTPVSSLSFGLTQQTRR78 pKa = 11.84SFSASASLAGKK89 pKa = 9.59RR90 pKa = 11.84ATYY93 pKa = 10.03NPSRR97 pKa = 11.84RR98 pKa = 11.84VQKK101 pKa = 10.2RR102 pKa = 11.84RR103 pKa = 11.84HH104 pKa = 5.33GFLARR109 pKa = 11.84LRR111 pKa = 11.84SRR113 pKa = 11.84GGRR116 pKa = 11.84KK117 pKa = 8.87VLQHH121 pKa = 6.19RR122 pKa = 11.84RR123 pKa = 11.84AKK125 pKa = 9.96GRR127 pKa = 11.84KK128 pKa = 7.78SLSWW132 pKa = 3.4
Molecular weight: 14.79 kDa
Isoelectric point according different methods:
Peptides (in silico digests for buttom-up proteomics)
Below you can find in silico digests of the whole proteome with Trypsin, Chymotrypsin, Trypsin+LysC, LysN, ArgC proteases suitable for different mass spec machines.| Try ESI |
 |
|---|
| ChTry ESI |
 |
|---|
| ArgC ESI |
 |
|---|
| LysN ESI |
 |
|---|
| TryLysC ESI |
 |
|---|
| Try MALDI |
 |
|---|
| ChTry MALDI |
 |
|---|
| ArgC MALDI |
 |
|---|
| LysN MALDI |
 |
|---|
| TryLysC MALDI |
 |
|---|
| Try LTQ |
 |
|---|
| ChTry LTQ |
 |
|---|
| ArgC LTQ |
 |
|---|
| LysN LTQ |
 |
|---|
| TryLysC LTQ |
 |
|---|
| Try MSlow |
 |
|---|
| ChTry MSlow |
 |
|---|
| ArgC MSlow |
 |
|---|
| LysN MSlow |
 |
|---|
| TryLysC MSlow |
 |
|---|
| Try MShigh |
 |
|---|
| ChTry MShigh |
 |
|---|
| ArgC MShigh |
 |
|---|
| LysN MShigh |
 |
|---|
| TryLysC MShigh |
 |
|---|
General Statistics
Number of major isoforms |
Number of additional isoforms |
Number of all proteins |
Number of amino acids |
Min. Seq. Length |
Max. Seq. Length |
Avg. Seq. Length |
Avg. Mol. Weight |
|---|---|---|---|---|---|---|---|
5199030 |
49 |
6146 |
452.9 |
50.19 |
Amino acid frequency
Ala |
Cys |
Asp |
Glu |
Phe |
Gly |
His |
Ile |
Lys |
Leu |
|---|---|---|---|---|---|---|---|---|---|
8.602 ± 0.018 | 1.331 ± 0.009 |
5.564 ± 0.016 | 6.077 ± 0.022 |
3.753 ± 0.014 | 6.722 ± 0.021 |
2.438 ± 0.01 | 4.944 ± 0.014 |
4.575 ± 0.017 | 9.195 ± 0.023 |
Met |
Asn |
Gln |
Pro |
Arg |
Ser |
Thr |
Val |
Trp |
Tyr |
|---|---|---|---|---|---|---|---|---|---|
2.153 ± 0.008 | 3.592 ± 0.012 |
5.949 ± 0.026 | 4.02 ± 0.014 |
6.291 ± 0.021 | 8.366 ± 0.026 |
5.867 ± 0.014 | 6.222 ± 0.017 |
1.492 ± 0.009 | 2.848 ± 0.013 |
Most of the basic statistics you can see at this page can be downloaded from this CSV file
Proteome-pI is available under Creative Commons Attribution-NoDerivs license, for more details see here
| Reference: Kozlowski LP. Proteome-pI 2.0: Proteome Isoelectric Point Database Update. Nucleic Acids Res. 2021, doi: 10.1093/nar/gkab944 | Contact: Lukasz P. Kozlowski |
