Capronia epimyces CBS 606.96
Taxonomy: cellular organisms; Eukaryota; Opisthokonta; Fungi; Dikarya; Ascomycota; saccharomyceta; Pezizomycotina; leotiomyceta; Eurotiomycetes; Chaetothyriomycetidae; Chaetothyriales; Herpotrichiellaceae; Capronia; Capronia epimyces
Average proteome isoelectric point is 6.45
Get precalculated fractions of proteins

Virtual 2D-PAGE plot for 10469 proteins (isoelectric point calculated using IPC2_protein)
Get csv file with sequences according to given criteria:
* You can choose from 21 different methods for calculating isoelectric point
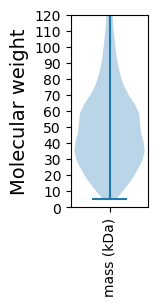
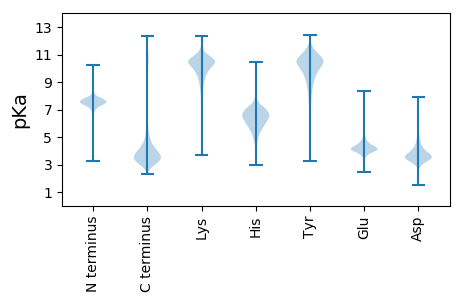
Summary statistics related to proteome-wise predictions


Protein with the lowest isoelectric point:
>tr|W9YJX4|W9YJX4_9EURO Translation initiation factor 2 subunit 1 OS=Capronia epimyces CBS 606.96 OX=1182542 GN=A1O3_06382 PE=3 SV=1
MM1 pKa = 7.62LQRR4 pKa = 11.84QKK6 pKa = 11.55DD7 pKa = 3.76GVLTLKK13 pKa = 10.92LSGSVLTDD21 pKa = 3.09QADD24 pKa = 3.83RR25 pKa = 11.84TGYY28 pKa = 9.72VAANYY33 pKa = 8.86QFQFDD38 pKa = 4.53APPQAGAIYY47 pKa = 9.51TSGFSLCSNNSLALGGSAIWYY68 pKa = 6.87EE69 pKa = 4.22CLSGSFYY76 pKa = 11.37NLYY79 pKa = 9.73DD80 pKa = 4.0RR81 pKa = 11.84KK82 pKa = 9.8WADD85 pKa = 3.1HH86 pKa = 6.64CFPIYY91 pKa = 10.37LVALIGSSAPPATQASDD108 pKa = 3.66GQPAATTVVPSITQISDD125 pKa = 3.15GQPQVTSAVVTQISDD140 pKa = 3.6GQPQGNTAVVTQISDD155 pKa = 3.85GQPQAATATGAPVSQISDD173 pKa = 3.86GQPQAPTGSPVSQISDD189 pKa = 3.82GQPQAPTGSPVSQISDD205 pKa = 3.82GQPQAPTGAPVSQISDD221 pKa = 3.86GQPQAPTATATPVSQISDD239 pKa = 3.92GQPQAPKK246 pKa = 8.88GTPVSQISDD255 pKa = 3.98GQPQAPTGAPVSQISDD271 pKa = 3.86GQPQAPTAIPVSQISDD287 pKa = 3.85GQPQAPTGAPVSQISDD303 pKa = 3.86GQPQAPTATPVSQISDD319 pKa = 3.98GQPQAPTATVEE330 pKa = 4.08AASATGTSSAAPATYY345 pKa = 9.62TGAAPRR351 pKa = 11.84DD352 pKa = 3.92TLSGSLAVAAGIVGAIALLL371 pKa = 3.88
MM1 pKa = 7.62LQRR4 pKa = 11.84QKK6 pKa = 11.55DD7 pKa = 3.76GVLTLKK13 pKa = 10.92LSGSVLTDD21 pKa = 3.09QADD24 pKa = 3.83RR25 pKa = 11.84TGYY28 pKa = 9.72VAANYY33 pKa = 8.86QFQFDD38 pKa = 4.53APPQAGAIYY47 pKa = 9.51TSGFSLCSNNSLALGGSAIWYY68 pKa = 6.87EE69 pKa = 4.22CLSGSFYY76 pKa = 11.37NLYY79 pKa = 9.73DD80 pKa = 4.0RR81 pKa = 11.84KK82 pKa = 9.8WADD85 pKa = 3.1HH86 pKa = 6.64CFPIYY91 pKa = 10.37LVALIGSSAPPATQASDD108 pKa = 3.66GQPAATTVVPSITQISDD125 pKa = 3.15GQPQVTSAVVTQISDD140 pKa = 3.6GQPQGNTAVVTQISDD155 pKa = 3.85GQPQAATATGAPVSQISDD173 pKa = 3.86GQPQAPTGSPVSQISDD189 pKa = 3.82GQPQAPTGSPVSQISDD205 pKa = 3.82GQPQAPTGAPVSQISDD221 pKa = 3.86GQPQAPTATATPVSQISDD239 pKa = 3.92GQPQAPKK246 pKa = 8.88GTPVSQISDD255 pKa = 3.98GQPQAPTGAPVSQISDD271 pKa = 3.86GQPQAPTAIPVSQISDD287 pKa = 3.85GQPQAPTGAPVSQISDD303 pKa = 3.86GQPQAPTATPVSQISDD319 pKa = 3.98GQPQAPTATVEE330 pKa = 4.08AASATGTSSAAPATYY345 pKa = 9.62TGAAPRR351 pKa = 11.84DD352 pKa = 3.92TLSGSLAVAAGIVGAIALLL371 pKa = 3.88
Molecular weight: 36.98 kDa
Isoelectric point according different methods:
Protein with the highest isoelectric point:
>tr|W9XQD0|W9XQD0_9EURO HpcH_HpaI domain-containing protein OS=Capronia epimyces CBS 606.96 OX=1182542 GN=A1O3_07809 PE=4 SV=1
MM1 pKa = 7.31TRR3 pKa = 11.84LKK5 pKa = 10.99NLLPLRR11 pKa = 11.84NQLPPLILLLKK22 pKa = 10.02NAPLLRR28 pKa = 11.84NQIPLKK34 pKa = 10.84NLLQPRR40 pKa = 11.84KK41 pKa = 9.46RR42 pKa = 11.84PRR44 pKa = 11.84LKK46 pKa = 10.84SPLLLKK52 pKa = 10.49RR53 pKa = 11.84PPPLMLLKK61 pKa = 10.46NRR63 pKa = 11.84PRR65 pKa = 11.84LKK67 pKa = 10.48SLPPLMLLPKK77 pKa = 10.08NRR79 pKa = 11.84PRR81 pKa = 11.84LKK83 pKa = 10.69SLLPLMLLPKK93 pKa = 10.24NRR95 pKa = 11.84PLLKK99 pKa = 10.44NQLLLRR105 pKa = 11.84IRR107 pKa = 11.84PRR109 pKa = 11.84LKK111 pKa = 10.71NLLPLKK117 pKa = 10.63NLLPPLKK124 pKa = 10.35NRR126 pKa = 11.84PRR128 pKa = 11.84QKK130 pKa = 10.8NLLRR134 pKa = 11.84RR135 pKa = 11.84KK136 pKa = 9.34NN137 pKa = 3.39
MM1 pKa = 7.31TRR3 pKa = 11.84LKK5 pKa = 10.99NLLPLRR11 pKa = 11.84NQLPPLILLLKK22 pKa = 10.02NAPLLRR28 pKa = 11.84NQIPLKK34 pKa = 10.84NLLQPRR40 pKa = 11.84KK41 pKa = 9.46RR42 pKa = 11.84PRR44 pKa = 11.84LKK46 pKa = 10.84SPLLLKK52 pKa = 10.49RR53 pKa = 11.84PPPLMLLKK61 pKa = 10.46NRR63 pKa = 11.84PRR65 pKa = 11.84LKK67 pKa = 10.48SLPPLMLLPKK77 pKa = 10.08NRR79 pKa = 11.84PRR81 pKa = 11.84LKK83 pKa = 10.69SLLPLMLLPKK93 pKa = 10.24NRR95 pKa = 11.84PLLKK99 pKa = 10.44NQLLLRR105 pKa = 11.84IRR107 pKa = 11.84PRR109 pKa = 11.84LKK111 pKa = 10.71NLLPLKK117 pKa = 10.63NLLPPLKK124 pKa = 10.35NRR126 pKa = 11.84PRR128 pKa = 11.84QKK130 pKa = 10.8NLLRR134 pKa = 11.84RR135 pKa = 11.84KK136 pKa = 9.34NN137 pKa = 3.39
Molecular weight: 16.24 kDa
Isoelectric point according different methods:
Peptides (in silico digests for buttom-up proteomics)
Below you can find in silico digests of the whole proteome with Trypsin, Chymotrypsin, Trypsin+LysC, LysN, ArgC proteases suitable for different mass spec machines.| Try ESI |
 |
|---|
| ChTry ESI |
 |
|---|
| ArgC ESI |
 |
|---|
| LysN ESI |
 |
|---|
| TryLysC ESI |
 |
|---|
| Try MALDI |
 |
|---|
| ChTry MALDI |
 |
|---|
| ArgC MALDI |
 |
|---|
| LysN MALDI |
 |
|---|
| TryLysC MALDI |
 |
|---|
| Try LTQ |
 |
|---|
| ChTry LTQ |
 |
|---|
| ArgC LTQ |
 |
|---|
| LysN LTQ |
 |
|---|
| TryLysC LTQ |
 |
|---|
| Try MSlow |
 |
|---|
| ChTry MSlow |
 |
|---|
| ArgC MSlow |
 |
|---|
| LysN MSlow |
 |
|---|
| TryLysC MSlow |
 |
|---|
| Try MShigh |
 |
|---|
| ChTry MShigh |
 |
|---|
| ArgC MShigh |
 |
|---|
| LysN MShigh |
 |
|---|
| TryLysC MShigh |
 |
|---|
General Statistics
Number of major isoforms |
Number of additional isoforms |
Number of all proteins |
Number of amino acids |
Min. Seq. Length |
Max. Seq. Length |
Avg. Seq. Length |
Avg. Mol. Weight |
|---|---|---|---|---|---|---|---|
0 |
5150417 |
50 |
5422 |
492.0 |
54.35 |
Amino acid frequency
Ala |
Cys |
Asp |
Glu |
Phe |
Gly |
His |
Ile |
Lys |
Leu |
|---|---|---|---|---|---|---|---|---|---|
8.864 ± 0.02 | 1.16 ± 0.009 |
5.789 ± 0.015 | 6.04 ± 0.021 |
3.634 ± 0.016 | 6.917 ± 0.02 |
2.509 ± 0.01 | 4.721 ± 0.016 |
4.62 ± 0.022 | 9.078 ± 0.025 |
Met |
Asn |
Gln |
Pro |
Arg |
Ser |
Thr |
Val |
Trp |
Tyr |
|---|---|---|---|---|---|---|---|---|---|
2.036 ± 0.008 | 3.445 ± 0.012 |
6.117 ± 0.023 | 4.182 ± 0.017 |
6.227 ± 0.02 | 8.151 ± 0.025 |
6.059 ± 0.019 | 6.278 ± 0.019 |
1.445 ± 0.009 | 2.728 ± 0.011 |
Most of the basic statistics you can see at this page can be downloaded from this CSV file
Proteome-pI is available under Creative Commons Attribution-NoDerivs license, for more details see here
| Reference: Kozlowski LP. Proteome-pI 2.0: Proteome Isoelectric Point Database Update. Nucleic Acids Res. 2021, doi: 10.1093/nar/gkab944 | Contact: Lukasz P. Kozlowski |
