Rhodococcus sp. LHW51113
Taxonomy: cellular organisms; Bacteria; Terrabacteria group; Actinobacteria; Actinomycetia; Corynebacteriales; Nocardiaceae; Rhodococcus
Average proteome isoelectric point is 5.89
Get precalculated fractions of proteins

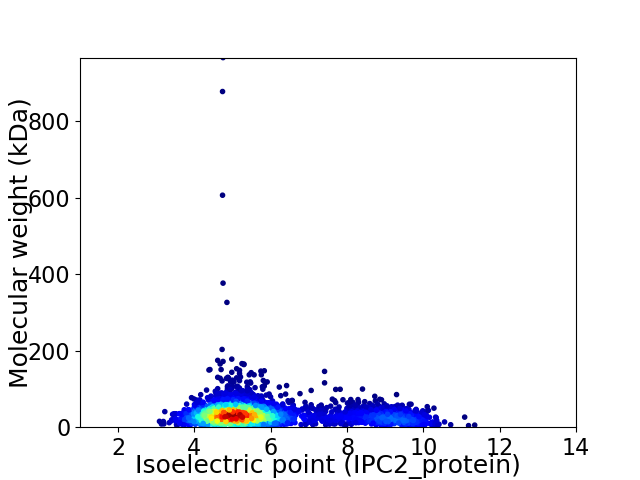
Virtual 2D-PAGE plot for 3281 proteins (isoelectric point calculated using IPC2_protein)
Get csv file with sequences according to given criteria:
* You can choose from 21 different methods for calculating isoelectric point
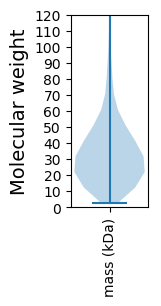
Summary statistics related to proteome-wise predictions


Protein with the lowest isoelectric point:
>tr|A0A3S3BNM3|A0A3S3BNM3_9NOCA DUF4233 domain-containing protein OS=Rhodococcus sp. LHW51113 OX=2487364 GN=EGT50_02690 PE=4 SV=1
MM1 pKa = 7.24FGVVSVSAMALGVAGMGAGAATADD25 pKa = 3.76TVVDD29 pKa = 3.89TVRR32 pKa = 11.84VGTAPFGVAVSPDD45 pKa = 2.97GSRR48 pKa = 11.84AYY50 pKa = 8.63VTNVVSDD57 pKa = 3.95SVSVIDD63 pKa = 3.7TAGNTVIDD71 pKa = 4.4SIGVGDD77 pKa = 4.58APAGVAVSPNGSHH90 pKa = 6.96VYY92 pKa = 8.51VTNQLEE98 pKa = 4.44DD99 pKa = 3.58TVSVIEE105 pKa = 4.19TAGNTVIDD113 pKa = 4.41TIEE116 pKa = 4.23VGDD119 pKa = 4.1TPVGVATTPDD129 pKa = 3.33GLGVYY134 pKa = 7.57VTNNGDD140 pKa = 3.45DD141 pKa = 3.66TVSVIEE147 pKa = 4.13TADD150 pKa = 3.63RR151 pKa = 11.84TVVEE155 pKa = 4.83TIGVGNGPQYY165 pKa = 11.41VAFTPNGSRR174 pKa = 11.84AFVTNALEE182 pKa = 4.47DD183 pKa = 3.85SVSVIEE189 pKa = 4.19TSEE192 pKa = 3.9NTLMNTIRR200 pKa = 11.84VGDD203 pKa = 4.04YY204 pKa = 10.49PRR206 pKa = 11.84GLAVTPDD213 pKa = 3.41GLRR216 pKa = 11.84VYY218 pKa = 9.63VANGGSDD225 pKa = 3.42TVSVIDD231 pKa = 3.72TATDD235 pKa = 3.55TVAQTIPAEE244 pKa = 4.19DD245 pKa = 4.57FPWGLALTPDD255 pKa = 3.87GSRR258 pKa = 11.84AYY260 pKa = 8.85VTNLYY265 pKa = 9.64DD266 pKa = 3.74ASVSVIDD273 pKa = 3.65TATNSVVEE281 pKa = 4.68RR282 pKa = 11.84IRR284 pKa = 11.84VGNYY288 pKa = 8.02PYY290 pKa = 10.95GVAVSPDD297 pKa = 3.35GSPVYY302 pKa = 10.39VVNHH306 pKa = 5.78EE307 pKa = 4.13ASTVSVIADD316 pKa = 4.03GTCFGSFCTSS326 pKa = 2.84
MM1 pKa = 7.24FGVVSVSAMALGVAGMGAGAATADD25 pKa = 3.76TVVDD29 pKa = 3.89TVRR32 pKa = 11.84VGTAPFGVAVSPDD45 pKa = 2.97GSRR48 pKa = 11.84AYY50 pKa = 8.63VTNVVSDD57 pKa = 3.95SVSVIDD63 pKa = 3.7TAGNTVIDD71 pKa = 4.4SIGVGDD77 pKa = 4.58APAGVAVSPNGSHH90 pKa = 6.96VYY92 pKa = 8.51VTNQLEE98 pKa = 4.44DD99 pKa = 3.58TVSVIEE105 pKa = 4.19TAGNTVIDD113 pKa = 4.41TIEE116 pKa = 4.23VGDD119 pKa = 4.1TPVGVATTPDD129 pKa = 3.33GLGVYY134 pKa = 7.57VTNNGDD140 pKa = 3.45DD141 pKa = 3.66TVSVIEE147 pKa = 4.13TADD150 pKa = 3.63RR151 pKa = 11.84TVVEE155 pKa = 4.83TIGVGNGPQYY165 pKa = 11.41VAFTPNGSRR174 pKa = 11.84AFVTNALEE182 pKa = 4.47DD183 pKa = 3.85SVSVIEE189 pKa = 4.19TSEE192 pKa = 3.9NTLMNTIRR200 pKa = 11.84VGDD203 pKa = 4.04YY204 pKa = 10.49PRR206 pKa = 11.84GLAVTPDD213 pKa = 3.41GLRR216 pKa = 11.84VYY218 pKa = 9.63VANGGSDD225 pKa = 3.42TVSVIDD231 pKa = 3.72TATDD235 pKa = 3.55TVAQTIPAEE244 pKa = 4.19DD245 pKa = 4.57FPWGLALTPDD255 pKa = 3.87GSRR258 pKa = 11.84AYY260 pKa = 8.85VTNLYY265 pKa = 9.64DD266 pKa = 3.74ASVSVIDD273 pKa = 3.65TATNSVVEE281 pKa = 4.68RR282 pKa = 11.84IRR284 pKa = 11.84VGNYY288 pKa = 8.02PYY290 pKa = 10.95GVAVSPDD297 pKa = 3.35GSPVYY302 pKa = 10.39VVNHH306 pKa = 5.78EE307 pKa = 4.13ASTVSVIADD316 pKa = 4.03GTCFGSFCTSS326 pKa = 2.84
Molecular weight: 33.02 kDa
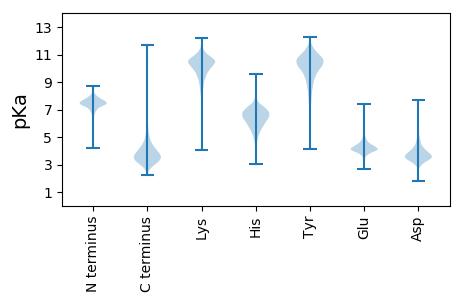
Isoelectric point according different methods:
Protein with the highest isoelectric point:
>tr|A0A3S3AKQ9|A0A3S3AKQ9_9NOCA Carboxylic ester hydrolase OS=Rhodococcus sp. LHW51113 OX=2487364 GN=EGT50_09675 PE=3 SV=1
MM1 pKa = 7.69AKK3 pKa = 10.06GKK5 pKa = 8.69RR6 pKa = 11.84TFQPNNRR13 pKa = 11.84RR14 pKa = 11.84RR15 pKa = 11.84ARR17 pKa = 11.84VHH19 pKa = 5.99GFRR22 pKa = 11.84LRR24 pKa = 11.84MRR26 pKa = 11.84TRR28 pKa = 11.84AGRR31 pKa = 11.84AIVSARR37 pKa = 11.84RR38 pKa = 11.84RR39 pKa = 11.84KK40 pKa = 9.72GRR42 pKa = 11.84ASLTAA47 pKa = 4.1
MM1 pKa = 7.69AKK3 pKa = 10.06GKK5 pKa = 8.69RR6 pKa = 11.84TFQPNNRR13 pKa = 11.84RR14 pKa = 11.84RR15 pKa = 11.84ARR17 pKa = 11.84VHH19 pKa = 5.99GFRR22 pKa = 11.84LRR24 pKa = 11.84MRR26 pKa = 11.84TRR28 pKa = 11.84AGRR31 pKa = 11.84AIVSARR37 pKa = 11.84RR38 pKa = 11.84RR39 pKa = 11.84KK40 pKa = 9.72GRR42 pKa = 11.84ASLTAA47 pKa = 4.1
Molecular weight: 5.48 kDa
Isoelectric point according different methods:
Peptides (in silico digests for buttom-up proteomics)
Below you can find in silico digests of the whole proteome with Trypsin, Chymotrypsin, Trypsin+LysC, LysN, ArgC proteases suitable for different mass spec machines.| Try ESI |
 |
|---|
| ChTry ESI |
 |
|---|
| ArgC ESI |
 |
|---|
| LysN ESI |
 |
|---|
| TryLysC ESI |
 |
|---|
| Try MALDI |
 |
|---|
| ChTry MALDI |
 |
|---|
| ArgC MALDI |
 |
|---|
| LysN MALDI |
 |
|---|
| TryLysC MALDI |
 |
|---|
| Try LTQ |
 |
|---|
| ChTry LTQ |
 |
|---|
| ArgC LTQ |
 |
|---|
| LysN LTQ |
 |
|---|
| TryLysC LTQ |
 |
|---|
| Try MSlow |
 |
|---|
| ChTry MSlow |
 |
|---|
| ArgC MSlow |
 |
|---|
| LysN MSlow |
 |
|---|
| TryLysC MSlow |
 |
|---|
| Try MShigh |
 |
|---|
| ChTry MShigh |
 |
|---|
| ArgC MShigh |
 |
|---|
| LysN MShigh |
 |
|---|
| TryLysC MShigh |
 |
|---|
General Statistics
Number of major isoforms |
Number of additional isoforms |
Number of all proteins |
Number of amino acids |
Min. Seq. Length |
Max. Seq. Length |
Avg. Seq. Length |
Avg. Mol. Weight |
|---|---|---|---|---|---|---|---|
0 |
1087130 |
21 |
8960 |
331.3 |
35.48 |
Amino acid frequency
Ala |
Cys |
Asp |
Glu |
Phe |
Gly |
His |
Ile |
Lys |
Leu |
|---|---|---|---|---|---|---|---|---|---|
12.554 ± 0.056 | 0.721 ± 0.011 |
6.346 ± 0.034 | 5.781 ± 0.031 |
2.981 ± 0.027 | 9.17 ± 0.038 |
2.042 ± 0.018 | 4.2 ± 0.028 |
2.097 ± 0.032 | 9.859 ± 0.044 |
Met |
Asn |
Gln |
Pro |
Arg |
Ser |
Thr |
Val |
Trp |
Tyr |
|---|---|---|---|---|---|---|---|---|---|
1.93 ± 0.017 | 2.089 ± 0.023 |
5.625 ± 0.035 | 2.776 ± 0.021 |
7.337 ± 0.04 | 5.763 ± 0.027 |
6.177 ± 0.033 | 9.169 ± 0.04 |
1.386 ± 0.019 | 1.994 ± 0.019 |
Most of the basic statistics you can see at this page can be downloaded from this CSV file
Proteome-pI is available under Creative Commons Attribution-NoDerivs license, for more details see here
| Reference: Kozlowski LP. Proteome-pI 2.0: Proteome Isoelectric Point Database Update. Nucleic Acids Res. 2021, doi: 10.1093/nar/gkab944 | Contact: Lukasz P. Kozlowski |
