Flavobacterium cellulosilyticum
Taxonomy: cellular organisms; Bacteria; FCB group; Bacteroidetes/Chlorobi group; Bacteroidetes; Flavobacteriia; Flavobacteriales; Flavobacteriaceae; Flavobacterium
Average proteome isoelectric point is 6.72
Get precalculated fractions of proteins

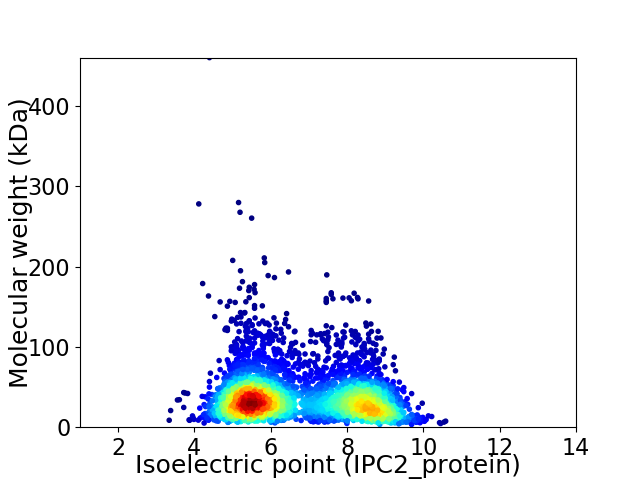
Virtual 2D-PAGE plot for 3677 proteins (isoelectric point calculated using IPC2_protein)
Get csv file with sequences according to given criteria:
* You can choose from 21 different methods for calculating isoelectric point
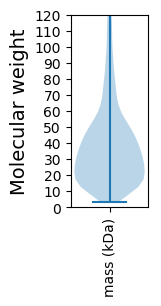
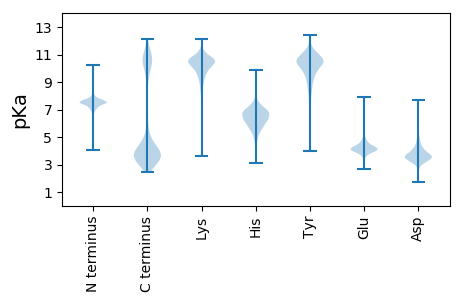
Summary statistics related to proteome-wise predictions


Protein with the lowest isoelectric point:
>tr|A0A4R5CJ79|A0A4R5CJ79_9FLAO Rrf2 family transcriptional regulator OS=Flavobacterium cellulosilyticum OX=2541731 GN=E0F76_00225 PE=4 SV=1
MM1 pKa = 7.05GQSSYY6 pKa = 10.92SQEE9 pKa = 3.62GWDD12 pKa = 5.41NEE14 pKa = 4.32EE15 pKa = 3.25EE16 pKa = 4.39WYY18 pKa = 10.45EE19 pKa = 4.06NEE21 pKa = 4.56SWDD24 pKa = 5.28SNDD27 pKa = 4.48NDD29 pKa = 4.31YY30 pKa = 10.94TNNWQDD36 pKa = 4.85FLSEE40 pKa = 4.06WFGLDD45 pKa = 2.71IAGITDD51 pKa = 4.07GGNFLLSNGDD61 pKa = 3.32YY62 pKa = 10.53FYY64 pKa = 10.62PDD66 pKa = 3.31SSNLDD71 pKa = 3.53EE72 pKa = 5.0VNVNSYY78 pKa = 10.11HH79 pKa = 7.6VSEE82 pKa = 4.29QYY84 pKa = 10.63EE85 pKa = 4.06YY86 pKa = 11.78VPIGEE91 pKa = 4.49NNGNPGGDD99 pKa = 3.34EE100 pKa = 4.16SEE102 pKa = 4.39EE103 pKa = 4.34TVDD106 pKa = 6.2DD107 pKa = 4.06PTDD110 pKa = 3.47NCSISYY116 pKa = 9.67CMPGYY121 pKa = 8.62TLQNCEE127 pKa = 4.36CVKK130 pKa = 10.44VSCTKK135 pKa = 9.85TCEE138 pKa = 3.82SGYY141 pKa = 10.75KK142 pKa = 10.47LNIDD146 pKa = 3.53TCEE149 pKa = 4.46CEE151 pKa = 5.0LLPPCWGTIQDD162 pKa = 4.41FEE164 pKa = 4.68TSNSFNTNTILNKK177 pKa = 10.39LNSTLGDD184 pKa = 3.58FGISADD190 pKa = 3.64VMDD193 pKa = 6.03SIKK196 pKa = 10.75QMNLFDD202 pKa = 5.24PKK204 pKa = 10.45TIATGTDD211 pKa = 3.24LVTFADD217 pKa = 4.04DD218 pKa = 4.1LGVVGDD224 pKa = 4.37GLQVALDD231 pKa = 3.53YY232 pKa = 11.27SKK234 pKa = 11.59YY235 pKa = 9.59IDD237 pKa = 4.05EE238 pKa = 5.4PSTQNLLRR246 pKa = 11.84TVLDD250 pKa = 4.0AASMALSPAASLALSTIDD268 pKa = 3.7YY269 pKa = 10.61FKK271 pKa = 11.41DD272 pKa = 3.11GDD274 pKa = 4.25GNSKK278 pKa = 10.84LDD280 pKa = 4.28LLLKK284 pKa = 10.15AASDD288 pKa = 4.47AIDD291 pKa = 4.12RR292 pKa = 11.84SLDD295 pKa = 3.55CNLGLGIRR303 pKa = 11.84NWVYY307 pKa = 11.28
MM1 pKa = 7.05GQSSYY6 pKa = 10.92SQEE9 pKa = 3.62GWDD12 pKa = 5.41NEE14 pKa = 4.32EE15 pKa = 3.25EE16 pKa = 4.39WYY18 pKa = 10.45EE19 pKa = 4.06NEE21 pKa = 4.56SWDD24 pKa = 5.28SNDD27 pKa = 4.48NDD29 pKa = 4.31YY30 pKa = 10.94TNNWQDD36 pKa = 4.85FLSEE40 pKa = 4.06WFGLDD45 pKa = 2.71IAGITDD51 pKa = 4.07GGNFLLSNGDD61 pKa = 3.32YY62 pKa = 10.53FYY64 pKa = 10.62PDD66 pKa = 3.31SSNLDD71 pKa = 3.53EE72 pKa = 5.0VNVNSYY78 pKa = 10.11HH79 pKa = 7.6VSEE82 pKa = 4.29QYY84 pKa = 10.63EE85 pKa = 4.06YY86 pKa = 11.78VPIGEE91 pKa = 4.49NNGNPGGDD99 pKa = 3.34EE100 pKa = 4.16SEE102 pKa = 4.39EE103 pKa = 4.34TVDD106 pKa = 6.2DD107 pKa = 4.06PTDD110 pKa = 3.47NCSISYY116 pKa = 9.67CMPGYY121 pKa = 8.62TLQNCEE127 pKa = 4.36CVKK130 pKa = 10.44VSCTKK135 pKa = 9.85TCEE138 pKa = 3.82SGYY141 pKa = 10.75KK142 pKa = 10.47LNIDD146 pKa = 3.53TCEE149 pKa = 4.46CEE151 pKa = 5.0LLPPCWGTIQDD162 pKa = 4.41FEE164 pKa = 4.68TSNSFNTNTILNKK177 pKa = 10.39LNSTLGDD184 pKa = 3.58FGISADD190 pKa = 3.64VMDD193 pKa = 6.03SIKK196 pKa = 10.75QMNLFDD202 pKa = 5.24PKK204 pKa = 10.45TIATGTDD211 pKa = 3.24LVTFADD217 pKa = 4.04DD218 pKa = 4.1LGVVGDD224 pKa = 4.37GLQVALDD231 pKa = 3.53YY232 pKa = 11.27SKK234 pKa = 11.59YY235 pKa = 9.59IDD237 pKa = 4.05EE238 pKa = 5.4PSTQNLLRR246 pKa = 11.84TVLDD250 pKa = 4.0AASMALSPAASLALSTIDD268 pKa = 3.7YY269 pKa = 10.61FKK271 pKa = 11.41DD272 pKa = 3.11GDD274 pKa = 4.25GNSKK278 pKa = 10.84LDD280 pKa = 4.28LLLKK284 pKa = 10.15AASDD288 pKa = 4.47AIDD291 pKa = 4.12RR292 pKa = 11.84SLDD295 pKa = 3.55CNLGLGIRR303 pKa = 11.84NWVYY307 pKa = 11.28
Molecular weight: 33.88 kDa
Isoelectric point according different methods:
Protein with the highest isoelectric point:
>tr|A0A4R5C6Y9|A0A4R5C6Y9_9FLAO Biopolymer transporter ExbD OS=Flavobacterium cellulosilyticum OX=2541731 GN=E0F76_13895 PE=3 SV=1
KKK2 pKa = 10.22FNTISRR8 pKa = 11.84TIINHHH14 pKa = 4.91YY15 pKa = 7.47TILNYYY21 pKa = 9.99DDD23 pKa = 4.54RR24 pKa = 11.84STNASAEEE32 pKa = 4.19FNAKKK37 pKa = 9.25KKK39 pKa = 10.63FRR41 pKa = 11.84SQFRR45 pKa = 11.84GVRR48 pKa = 11.84NIEEE52 pKa = 3.78FLFRR56 pKa = 11.84LTNIYYY62 pKa = 10.64
KKK2 pKa = 10.22FNTISRR8 pKa = 11.84TIINHHH14 pKa = 4.91YY15 pKa = 7.47TILNYYY21 pKa = 9.99DDD23 pKa = 4.54RR24 pKa = 11.84STNASAEEE32 pKa = 4.19FNAKKK37 pKa = 9.25KKK39 pKa = 10.63FRR41 pKa = 11.84SQFRR45 pKa = 11.84GVRR48 pKa = 11.84NIEEE52 pKa = 3.78FLFRR56 pKa = 11.84LTNIYYY62 pKa = 10.64
Molecular weight: 7.36 kDa
Isoelectric point according different methods:
Peptides (in silico digests for buttom-up proteomics)
Below you can find in silico digests of the whole proteome with Trypsin, Chymotrypsin, Trypsin+LysC, LysN, ArgC proteases suitable for different mass spec machines.| Try ESI |
 |
|---|
| ChTry ESI |
 |
|---|
| ArgC ESI |
 |
|---|
| LysN ESI |
 |
|---|
| TryLysC ESI |
 |
|---|
| Try MALDI |
 |
|---|
| ChTry MALDI |
 |
|---|
| ArgC MALDI |
 |
|---|
| LysN MALDI |
 |
|---|
| TryLysC MALDI |
 |
|---|
| Try LTQ |
 |
|---|
| ChTry LTQ |
 |
|---|
| ArgC LTQ |
 |
|---|
| LysN LTQ |
 |
|---|
| TryLysC LTQ |
 |
|---|
| Try MSlow |
 |
|---|
| ChTry MSlow |
 |
|---|
| ArgC MSlow |
 |
|---|
| LysN MSlow |
 |
|---|
| TryLysC MSlow |
 |
|---|
| Try MShigh |
 |
|---|
| ChTry MShigh |
 |
|---|
| ArgC MShigh |
 |
|---|
| LysN MShigh |
 |
|---|
| TryLysC MShigh |
 |
|---|
General Statistics
Number of major isoforms |
Number of additional isoforms |
Number of all proteins |
Number of amino acids |
Min. Seq. Length |
Max. Seq. Length |
Avg. Seq. Length |
Avg. Mol. Weight |
|---|---|---|---|---|---|---|---|
0 |
1329845 |
27 |
4425 |
361.7 |
40.7 |
Amino acid frequency
Ala |
Cys |
Asp |
Glu |
Phe |
Gly |
His |
Ile |
Lys |
Leu |
|---|---|---|---|---|---|---|---|---|---|
6.336 ± 0.037 | 0.795 ± 0.013 |
5.215 ± 0.028 | 6.085 ± 0.049 |
5.243 ± 0.037 | 6.441 ± 0.038 |
1.627 ± 0.017 | 8.454 ± 0.042 |
7.977 ± 0.053 | 9.047 ± 0.041 |
Met |
Asn |
Gln |
Pro |
Arg |
Ser |
Thr |
Val |
Trp |
Tyr |
|---|---|---|---|---|---|---|---|---|---|
2.213 ± 0.024 | 6.655 ± 0.043 |
3.449 ± 0.024 | 3.341 ± 0.025 |
3.031 ± 0.025 | 6.78 ± 0.042 |
6.046 ± 0.078 | 6.056 ± 0.032 |
1.124 ± 0.016 | 4.087 ± 0.024 |
Most of the basic statistics you can see at this page can be downloaded from this CSV file
Proteome-pI is available under Creative Commons Attribution-NoDerivs license, for more details see here
| Reference: Kozlowski LP. Proteome-pI 2.0: Proteome Isoelectric Point Database Update. Nucleic Acids Res. 2021, doi: 10.1093/nar/gkab944 | Contact: Lukasz P. Kozlowski |
