Desulfobacca acetoxidans (strain ATCC 700848 / DSM 11109 / ASRB2)
Taxonomy: cellular organisms; Bacteria; Proteobacteria; delta/epsilon subdivisions; Deltaproteobacteria; Syntrophobacterales; Syntrophaceae; Desulfobacca; Desulfobacca acetoxidans
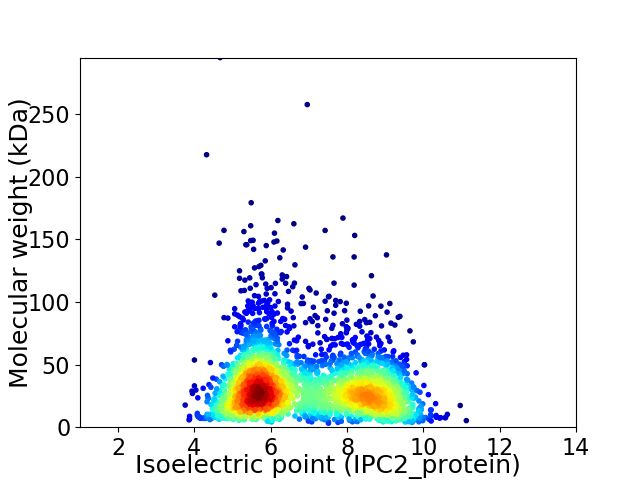
Average proteome isoelectric point is 6.9
Get precalculated fractions of proteins

Virtual 2D-PAGE plot for 2859 proteins (isoelectric point calculated using IPC2_protein)
Get csv file with sequences according to given criteria:
* You can choose from 21 different methods for calculating isoelectric point
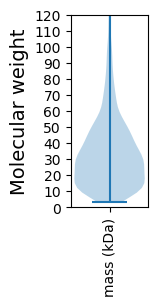
Summary statistics related to proteome-wise predictions


Protein with the lowest isoelectric point:
>tr|F2NFD9|F2NFD9_DESAR Uncharacterized protein OS=Desulfobacca acetoxidans (strain ATCC 700848 / DSM 11109 / ASRB2) OX=880072 GN=Desac_2231 PE=4 SV=1
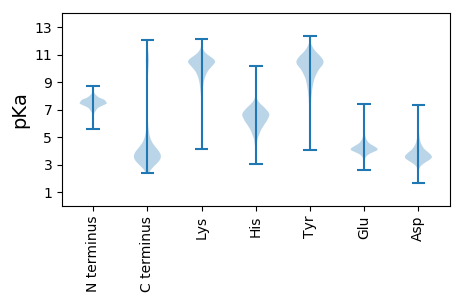
MM1 pKa = 7.65KK2 pKa = 10.31KK3 pKa = 9.76NLSIILILWIVALAAGTAQAFTFNDD28 pKa = 3.21VNIWAGSGSNSAGLVIHH45 pKa = 6.67WSAPEE50 pKa = 4.06VYY52 pKa = 10.31NNTSMPAPIADD63 pKa = 3.3ISVAWGYY70 pKa = 11.43KK71 pKa = 9.78FDD73 pKa = 3.87GTANAEE79 pKa = 4.19TMMVALAAADD89 pKa = 3.51PRR91 pKa = 11.84LYY93 pKa = 10.86LLAGGQPGLGMAILGIGYY111 pKa = 9.34DD112 pKa = 3.79LNNNGVFGLSDD123 pKa = 3.72GSTTYY128 pKa = 9.76TAADD132 pKa = 3.79FANGILADD140 pKa = 3.96QPYY143 pKa = 10.86GDD145 pKa = 5.63ADD147 pKa = 3.89TLLPTDD153 pKa = 4.81PGDD156 pKa = 4.09LYY158 pKa = 10.57WGGWYY163 pKa = 10.15GPNWEE168 pKa = 4.71LWHH171 pKa = 5.81EE172 pKa = 4.07QGGNGGFTSAPDD184 pKa = 3.66RR185 pKa = 11.84GSDD188 pKa = 3.97LYY190 pKa = 9.37WTGSFFSGSHH200 pKa = 5.94GEE202 pKa = 3.81WDD204 pKa = 3.97FSGLGITSLSLEE216 pKa = 4.6DD217 pKa = 4.31GSWVGWSVAAGGLDD231 pKa = 3.04MGDD234 pKa = 3.38PMGEE238 pKa = 4.05GTLAWMNHH246 pKa = 4.55KK247 pKa = 9.65QAPGEE252 pKa = 3.91PLAAPVPITGAVWLLGSGLLRR273 pKa = 11.84LIGICRR279 pKa = 11.84RR280 pKa = 11.84CASS283 pKa = 3.41
MM1 pKa = 7.65KK2 pKa = 10.31KK3 pKa = 9.76NLSIILILWIVALAAGTAQAFTFNDD28 pKa = 3.21VNIWAGSGSNSAGLVIHH45 pKa = 6.67WSAPEE50 pKa = 4.06VYY52 pKa = 10.31NNTSMPAPIADD63 pKa = 3.3ISVAWGYY70 pKa = 11.43KK71 pKa = 9.78FDD73 pKa = 3.87GTANAEE79 pKa = 4.19TMMVALAAADD89 pKa = 3.51PRR91 pKa = 11.84LYY93 pKa = 10.86LLAGGQPGLGMAILGIGYY111 pKa = 9.34DD112 pKa = 3.79LNNNGVFGLSDD123 pKa = 3.72GSTTYY128 pKa = 9.76TAADD132 pKa = 3.79FANGILADD140 pKa = 3.96QPYY143 pKa = 10.86GDD145 pKa = 5.63ADD147 pKa = 3.89TLLPTDD153 pKa = 4.81PGDD156 pKa = 4.09LYY158 pKa = 10.57WGGWYY163 pKa = 10.15GPNWEE168 pKa = 4.71LWHH171 pKa = 5.81EE172 pKa = 4.07QGGNGGFTSAPDD184 pKa = 3.66RR185 pKa = 11.84GSDD188 pKa = 3.97LYY190 pKa = 9.37WTGSFFSGSHH200 pKa = 5.94GEE202 pKa = 3.81WDD204 pKa = 3.97FSGLGITSLSLEE216 pKa = 4.6DD217 pKa = 4.31GSWVGWSVAAGGLDD231 pKa = 3.04MGDD234 pKa = 3.38PMGEE238 pKa = 4.05GTLAWMNHH246 pKa = 4.55KK247 pKa = 9.65QAPGEE252 pKa = 3.91PLAAPVPITGAVWLLGSGLLRR273 pKa = 11.84LIGICRR279 pKa = 11.84RR280 pKa = 11.84CASS283 pKa = 3.41
Molecular weight: 29.64 kDa
Isoelectric point according different methods:
Protein with the highest isoelectric point:
>tr|F2NH63|F2NH63_DESAR Methyl-viologen-reducing hydrogenase delta subunit OS=Desulfobacca acetoxidans (strain ATCC 700848 / DSM 11109 / ASRB2) OX=880072 GN=Desac_1039 PE=4 SV=1
MM1 pKa = 7.28KK2 pKa = 9.44RR3 pKa = 11.84TYY5 pKa = 10.08QPHH8 pKa = 5.37NLKK11 pKa = 10.35RR12 pKa = 11.84ARR14 pKa = 11.84TFGFLTRR21 pKa = 11.84MSTRR25 pKa = 11.84GGRR28 pKa = 11.84LVIKK32 pKa = 10.37RR33 pKa = 11.84RR34 pKa = 11.84RR35 pKa = 11.84AKK37 pKa = 9.84GRR39 pKa = 11.84KK40 pKa = 8.85RR41 pKa = 11.84LSAA44 pKa = 3.96
MM1 pKa = 7.28KK2 pKa = 9.44RR3 pKa = 11.84TYY5 pKa = 10.08QPHH8 pKa = 5.37NLKK11 pKa = 10.35RR12 pKa = 11.84ARR14 pKa = 11.84TFGFLTRR21 pKa = 11.84MSTRR25 pKa = 11.84GGRR28 pKa = 11.84LVIKK32 pKa = 10.37RR33 pKa = 11.84RR34 pKa = 11.84RR35 pKa = 11.84AKK37 pKa = 9.84GRR39 pKa = 11.84KK40 pKa = 8.85RR41 pKa = 11.84LSAA44 pKa = 3.96
Molecular weight: 5.26 kDa
Isoelectric point according different methods:
Peptides (in silico digests for buttom-up proteomics)
Below you can find in silico digests of the whole proteome with Trypsin, Chymotrypsin, Trypsin+LysC, LysN, ArgC proteases suitable for different mass spec machines.| Try ESI |
 |
|---|
| ChTry ESI |
 |
|---|
| ArgC ESI |
 |
|---|
| LysN ESI |
 |
|---|
| TryLysC ESI |
 |
|---|
| Try MALDI |
 |
|---|
| ChTry MALDI |
 |
|---|
| ArgC MALDI |
 |
|---|
| LysN MALDI |
 |
|---|
| TryLysC MALDI |
 |
|---|
| Try LTQ |
 |
|---|
| ChTry LTQ |
 |
|---|
| ArgC LTQ |
 |
|---|
| LysN LTQ |
 |
|---|
| TryLysC LTQ |
 |
|---|
| Try MSlow |
 |
|---|
| ChTry MSlow |
 |
|---|
| ArgC MSlow |
 |
|---|
| LysN MSlow |
 |
|---|
| TryLysC MSlow |
 |
|---|
| Try MShigh |
 |
|---|
| ChTry MShigh |
 |
|---|
| ArgC MShigh |
 |
|---|
| LysN MShigh |
 |
|---|
| TryLysC MShigh |
 |
|---|
General Statistics
Number of major isoforms |
Number of additional isoforms |
Number of all proteins |
Number of amino acids |
Min. Seq. Length |
Max. Seq. Length |
Avg. Seq. Length |
Avg. Mol. Weight |
|---|---|---|---|---|---|---|---|
0 |
919224 |
30 |
3125 |
321.5 |
35.77 |
Amino acid frequency
Ala |
Cys |
Asp |
Glu |
Phe |
Gly |
His |
Ile |
Lys |
Leu |
|---|---|---|---|---|---|---|---|---|---|
8.986 ± 0.047 | 1.22 ± 0.022 |
4.76 ± 0.027 | 6.304 ± 0.042 |
4.124 ± 0.032 | 7.676 ± 0.066 |
2.093 ± 0.022 | 6.222 ± 0.04 |
4.589 ± 0.043 | 11.506 ± 0.055 |
Met |
Asn |
Gln |
Pro |
Arg |
Ser |
Thr |
Val |
Trp |
Tyr |
|---|---|---|---|---|---|---|---|---|---|
2.239 ± 0.023 | 3.181 ± 0.033 |
5.119 ± 0.031 | 4.271 ± 0.029 |
6.444 ± 0.039 | 5.196 ± 0.031 |
4.913 ± 0.032 | 6.838 ± 0.042 |
1.275 ± 0.021 | 3.043 ± 0.028 |
Most of the basic statistics you can see at this page can be downloaded from this CSV file
Proteome-pI is available under Creative Commons Attribution-NoDerivs license, for more details see here
| Reference: Kozlowski LP. Proteome-pI 2.0: Proteome Isoelectric Point Database Update. Nucleic Acids Res. 2021, doi: 10.1093/nar/gkab944 | Contact: Lukasz P. Kozlowski |
