Cardinium endosymbiont of Dermatophagoides farinae
Taxonomy: cellular organisms; Bacteria; FCB group; Bacteroidetes/Chlorobi group; Bacteroidetes; Cytophagia; Cytophagales; Amoebophilaceae; Candidatus Cardinium; unclassified Candidatus Cardinium
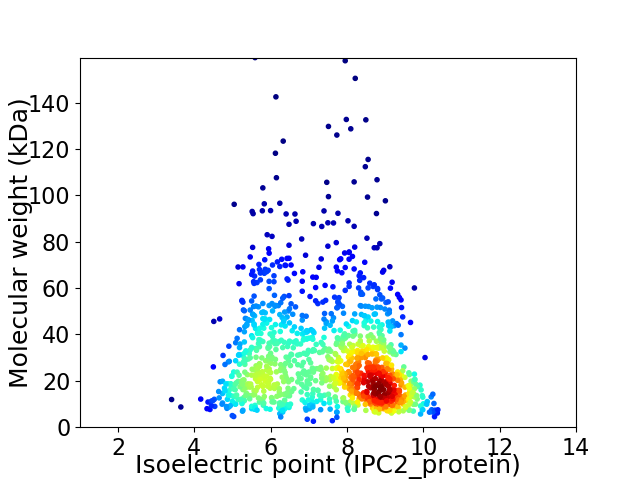
Average proteome isoelectric point is 7.39
Get precalculated fractions of proteins

Virtual 2D-PAGE plot for 1187 proteins (isoelectric point calculated using IPC2_protein)
Get csv file with sequences according to given criteria:
* You can choose from 21 different methods for calculating isoelectric point
Summary statistics related to proteome-wise predictions


Protein with the lowest isoelectric point:
>tr|A0A556QWR9|A0A556QWR9_9BACT Glutamyl-tRNA(Gln) amidotransferase subunit A OS=Cardinium endosymbiont of Dermatophagoides farinae OX=2597823 GN=gatA PE=3 SV=1
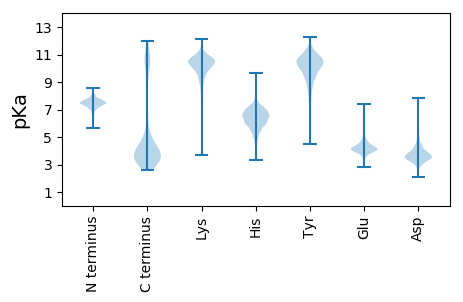
MM1 pKa = 7.24YY2 pKa = 7.76WTLEE6 pKa = 4.53LISHH10 pKa = 7.04LEE12 pKa = 3.97DD13 pKa = 4.46APWPAIKK20 pKa = 10.51DD21 pKa = 3.71EE22 pKa = 5.17LIDD25 pKa = 3.55YY26 pKa = 8.44AKK28 pKa = 10.6RR29 pKa = 11.84SGAPFEE35 pKa = 4.54VIRR38 pKa = 11.84NLEE41 pKa = 3.99EE42 pKa = 6.08LDD44 pKa = 4.72DD45 pKa = 5.89DD46 pKa = 5.05DD47 pKa = 5.43YY48 pKa = 11.54PYY50 pKa = 11.31NSPEE54 pKa = 4.61EE55 pKa = 3.98IWPDD59 pKa = 3.69YY60 pKa = 8.44PTGDD64 pKa = 3.16DD65 pKa = 3.85FVFNEE70 pKa = 4.67DD71 pKa = 3.35EE72 pKa = 4.34YY73 pKa = 11.97
MM1 pKa = 7.24YY2 pKa = 7.76WTLEE6 pKa = 4.53LISHH10 pKa = 7.04LEE12 pKa = 3.97DD13 pKa = 4.46APWPAIKK20 pKa = 10.51DD21 pKa = 3.71EE22 pKa = 5.17LIDD25 pKa = 3.55YY26 pKa = 8.44AKK28 pKa = 10.6RR29 pKa = 11.84SGAPFEE35 pKa = 4.54VIRR38 pKa = 11.84NLEE41 pKa = 3.99EE42 pKa = 6.08LDD44 pKa = 4.72DD45 pKa = 5.89DD46 pKa = 5.05DD47 pKa = 5.43YY48 pKa = 11.54PYY50 pKa = 11.31NSPEE54 pKa = 4.61EE55 pKa = 3.98IWPDD59 pKa = 3.69YY60 pKa = 8.44PTGDD64 pKa = 3.16DD65 pKa = 3.85FVFNEE70 pKa = 4.67DD71 pKa = 3.35EE72 pKa = 4.34YY73 pKa = 11.97
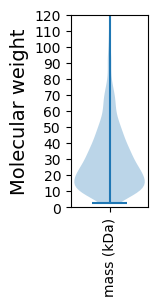
Molecular weight: 8.72 kDa
Isoelectric point according different methods:
Protein with the highest isoelectric point:
>tr|A0A556QXD1|A0A556QXD1_9BACT Uncharacterized protein OS=Cardinium endosymbiont of Dermatophagoides farinae OX=2597823 GN=FPG78_04875 PE=3 SV=1
MM1 pKa = 7.14VKK3 pKa = 10.14RR4 pKa = 11.84YY5 pKa = 6.83TCARR9 pKa = 11.84VGLLIGLLSLNILSACVHH27 pKa = 5.69TRR29 pKa = 11.84QPFIGRR35 pKa = 11.84DD36 pKa = 3.09PAIRR40 pKa = 11.84WDD42 pKa = 3.6YY43 pKa = 7.58TQRR46 pKa = 11.84DD47 pKa = 3.51YY48 pKa = 10.35TQRR51 pKa = 11.84YY52 pKa = 6.43EE53 pKa = 3.82QDD55 pKa = 2.68TGIGDD60 pKa = 3.65KK61 pKa = 10.76FKK63 pKa = 10.64IIVPFTFLILWVTLFPAWIIKK84 pKa = 8.01MSPNTNSSSGFNRR97 pKa = 11.84TGLHH101 pKa = 6.26GEE103 pKa = 4.11DD104 pKa = 3.33AFFTKK109 pKa = 10.21GVRR112 pKa = 11.84PFMFDD117 pKa = 3.05PVRR120 pKa = 11.84RR121 pKa = 11.84SIPNEE126 pKa = 3.51RR127 pKa = 11.84LGNSSVIPVKK137 pKa = 10.54KK138 pKa = 10.42LNRR141 pKa = 11.84FQKK144 pKa = 9.27TLALAVDD151 pKa = 4.16KK152 pKa = 10.76FSAGRR157 pKa = 11.84RR158 pKa = 11.84TQSNMMPP165 pKa = 3.81
MM1 pKa = 7.14VKK3 pKa = 10.14RR4 pKa = 11.84YY5 pKa = 6.83TCARR9 pKa = 11.84VGLLIGLLSLNILSACVHH27 pKa = 5.69TRR29 pKa = 11.84QPFIGRR35 pKa = 11.84DD36 pKa = 3.09PAIRR40 pKa = 11.84WDD42 pKa = 3.6YY43 pKa = 7.58TQRR46 pKa = 11.84DD47 pKa = 3.51YY48 pKa = 10.35TQRR51 pKa = 11.84YY52 pKa = 6.43EE53 pKa = 3.82QDD55 pKa = 2.68TGIGDD60 pKa = 3.65KK61 pKa = 10.76FKK63 pKa = 10.64IIVPFTFLILWVTLFPAWIIKK84 pKa = 8.01MSPNTNSSSGFNRR97 pKa = 11.84TGLHH101 pKa = 6.26GEE103 pKa = 4.11DD104 pKa = 3.33AFFTKK109 pKa = 10.21GVRR112 pKa = 11.84PFMFDD117 pKa = 3.05PVRR120 pKa = 11.84RR121 pKa = 11.84SIPNEE126 pKa = 3.51RR127 pKa = 11.84LGNSSVIPVKK137 pKa = 10.54KK138 pKa = 10.42LNRR141 pKa = 11.84FQKK144 pKa = 9.27TLALAVDD151 pKa = 4.16KK152 pKa = 10.76FSAGRR157 pKa = 11.84RR158 pKa = 11.84TQSNMMPP165 pKa = 3.81
Molecular weight: 18.89 kDa
Isoelectric point according different methods:
Peptides (in silico digests for buttom-up proteomics)
Below you can find in silico digests of the whole proteome with Trypsin, Chymotrypsin, Trypsin+LysC, LysN, ArgC proteases suitable for different mass spec machines.| Try ESI |
 |
|---|
| ChTry ESI |
 |
|---|
| ArgC ESI |
 |
|---|
| LysN ESI |
 |
|---|
| TryLysC ESI |
 |
|---|
| Try MALDI |
 |
|---|
| ChTry MALDI |
 |
|---|
| ArgC MALDI |
 |
|---|
| LysN MALDI |
 |
|---|
| TryLysC MALDI |
 |
|---|
| Try LTQ |
 |
|---|
| ChTry LTQ |
 |
|---|
| ArgC LTQ |
 |
|---|
| LysN LTQ |
 |
|---|
| TryLysC LTQ |
 |
|---|
| Try MSlow |
 |
|---|
| ChTry MSlow |
 |
|---|
| ArgC MSlow |
 |
|---|
| LysN MSlow |
 |
|---|
| TryLysC MSlow |
 |
|---|
| Try MShigh |
 |
|---|
| ChTry MShigh |
 |
|---|
| ArgC MShigh |
 |
|---|
| LysN MShigh |
 |
|---|
| TryLysC MShigh |
 |
|---|
General Statistics
Number of major isoforms |
Number of additional isoforms |
Number of all proteins |
Number of amino acids |
Min. Seq. Length |
Max. Seq. Length |
Avg. Seq. Length |
Avg. Mol. Weight |
|---|---|---|---|---|---|---|---|
0 |
330757 |
21 |
1420 |
278.6 |
31.48 |
Amino acid frequency
Ala |
Cys |
Asp |
Glu |
Phe |
Gly |
His |
Ile |
Lys |
Leu |
|---|---|---|---|---|---|---|---|---|---|
7.195 ± 0.071 | 1.465 ± 0.03 |
4.949 ± 0.056 | 5.538 ± 0.068 |
4.507 ± 0.058 | 5.701 ± 0.056 |
2.624 ± 0.035 | 7.882 ± 0.068 |
7.73 ± 0.077 | 10.731 ± 0.07 |
Met |
Asn |
Gln |
Pro |
Arg |
Ser |
Thr |
Val |
Trp |
Tyr |
|---|---|---|---|---|---|---|---|---|---|
2.302 ± 0.033 | 4.697 ± 0.064 |
3.767 ± 0.044 | 4.198 ± 0.05 |
4.063 ± 0.045 | 6.578 ± 0.073 |
5.35 ± 0.047 | 5.669 ± 0.054 |
1.008 ± 0.024 | 4.046 ± 0.048 |
Most of the basic statistics you can see at this page can be downloaded from this CSV file
Proteome-pI is available under Creative Commons Attribution-NoDerivs license, for more details see here
| Reference: Kozlowski LP. Proteome-pI 2.0: Proteome Isoelectric Point Database Update. Nucleic Acids Res. 2021, doi: 10.1093/nar/gkab944 | Contact: Lukasz P. Kozlowski |
