Cellulomonas gilvus (strain ATCC 13127 / NRRL B-14078) (Cellvibrio gilvus)
Taxonomy: cellular organisms; Bacteria; Terrabacteria group; Actinobacteria; Actinomycetia; Micrococcales; Cellulomonadaceae; Cellulomonas; Cellulomonas gilvus
Average proteome isoelectric point is 6.16
Get precalculated fractions of proteins

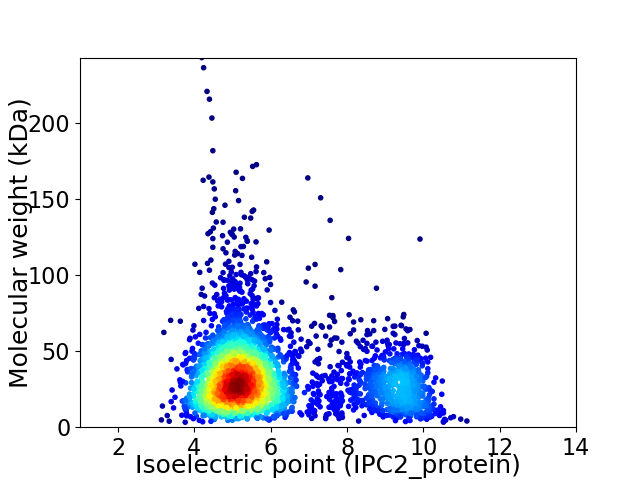
Virtual 2D-PAGE plot for 3153 proteins (isoelectric point calculated using IPC2_protein)
Get csv file with sequences according to given criteria:
* You can choose from 21 different methods for calculating isoelectric point
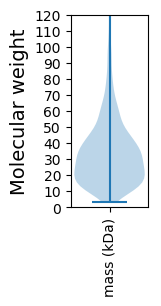
Summary statistics related to proteome-wise predictions


Protein with the lowest isoelectric point:
>tr|F8A7B7|F8A7B7_CELGA Uncharacterized protein OS=Cellulomonas gilvus (strain ATCC 13127 / NRRL B-14078) OX=593907 GN=Celgi_0656 PE=4 SV=1
MM1 pKa = 7.81ASTLAHH7 pKa = 6.29RR8 pKa = 11.84RR9 pKa = 11.84TLRR12 pKa = 11.84AALSLVPIAALAACSLTSTDD32 pKa = 4.98DD33 pKa = 3.42PAAPSTSASAGPSSGAPGTVTLVTHH58 pKa = 7.31DD59 pKa = 4.28SFALADD65 pKa = 4.0GLLEE69 pKa = 5.35DD70 pKa = 5.16FTASTGITVEE80 pKa = 4.32VVQPGDD86 pKa = 3.06AGTLVNQLVLTKK98 pKa = 10.38DD99 pKa = 3.4APLGDD104 pKa = 3.82AVFGIDD110 pKa = 3.17NAFASRR116 pKa = 11.84ALDD119 pKa = 3.57EE120 pKa = 5.35GVLAPYY126 pKa = 9.77TSAAPAAADD135 pKa = 3.54AATHH139 pKa = 6.72ALAGDD144 pKa = 3.88DD145 pKa = 4.22EE146 pKa = 4.92GALTAVDD153 pKa = 4.0YY154 pKa = 11.68GDD156 pKa = 3.35VCLNVDD162 pKa = 3.66HH163 pKa = 7.26AWFDD167 pKa = 3.51EE168 pKa = 4.27HH169 pKa = 7.42DD170 pKa = 4.02VPEE173 pKa = 5.27PEE175 pKa = 4.48TLDD178 pKa = 5.03DD179 pKa = 5.71LLDD182 pKa = 4.0PQYY185 pKa = 11.48EE186 pKa = 4.27DD187 pKa = 4.59LLVVPNPVTSSPGFAFLLTTVAASSDD213 pKa = 2.95GWQDD217 pKa = 3.07YY218 pKa = 8.13WQGLVDD224 pKa = 4.39NGLKK228 pKa = 10.42VADD231 pKa = 4.27GWSDD235 pKa = 3.72AYY237 pKa = 10.15FTDD240 pKa = 4.93FSGGGGDD247 pKa = 3.76GPRR250 pKa = 11.84PIVLSYY256 pKa = 11.15ASSPPSTVPEE266 pKa = 4.83GGTEE270 pKa = 4.01PTTGALLGTCFRR282 pKa = 11.84QVEE285 pKa = 4.42YY286 pKa = 11.18AGVLANAQNPSGAQQLIDD304 pKa = 4.3FLLSDD309 pKa = 4.88AVQADD314 pKa = 4.11IPGSMYY320 pKa = 9.9MYY322 pKa = 9.75PVSTAVEE329 pKa = 5.0LPQEE333 pKa = 4.2WQQWAPLAEE342 pKa = 4.45QPFEE346 pKa = 4.09VAPDD350 pKa = 4.08EE351 pKa = 4.35IAAEE355 pKa = 3.95RR356 pKa = 11.84DD357 pKa = 2.95TWLEE361 pKa = 3.74QWSDD365 pKa = 3.52TVIGG369 pKa = 3.88
MM1 pKa = 7.81ASTLAHH7 pKa = 6.29RR8 pKa = 11.84RR9 pKa = 11.84TLRR12 pKa = 11.84AALSLVPIAALAACSLTSTDD32 pKa = 4.98DD33 pKa = 3.42PAAPSTSASAGPSSGAPGTVTLVTHH58 pKa = 7.31DD59 pKa = 4.28SFALADD65 pKa = 4.0GLLEE69 pKa = 5.35DD70 pKa = 5.16FTASTGITVEE80 pKa = 4.32VVQPGDD86 pKa = 3.06AGTLVNQLVLTKK98 pKa = 10.38DD99 pKa = 3.4APLGDD104 pKa = 3.82AVFGIDD110 pKa = 3.17NAFASRR116 pKa = 11.84ALDD119 pKa = 3.57EE120 pKa = 5.35GVLAPYY126 pKa = 9.77TSAAPAAADD135 pKa = 3.54AATHH139 pKa = 6.72ALAGDD144 pKa = 3.88DD145 pKa = 4.22EE146 pKa = 4.92GALTAVDD153 pKa = 4.0YY154 pKa = 11.68GDD156 pKa = 3.35VCLNVDD162 pKa = 3.66HH163 pKa = 7.26AWFDD167 pKa = 3.51EE168 pKa = 4.27HH169 pKa = 7.42DD170 pKa = 4.02VPEE173 pKa = 5.27PEE175 pKa = 4.48TLDD178 pKa = 5.03DD179 pKa = 5.71LLDD182 pKa = 4.0PQYY185 pKa = 11.48EE186 pKa = 4.27DD187 pKa = 4.59LLVVPNPVTSSPGFAFLLTTVAASSDD213 pKa = 2.95GWQDD217 pKa = 3.07YY218 pKa = 8.13WQGLVDD224 pKa = 4.39NGLKK228 pKa = 10.42VADD231 pKa = 4.27GWSDD235 pKa = 3.72AYY237 pKa = 10.15FTDD240 pKa = 4.93FSGGGGDD247 pKa = 3.76GPRR250 pKa = 11.84PIVLSYY256 pKa = 11.15ASSPPSTVPEE266 pKa = 4.83GGTEE270 pKa = 4.01PTTGALLGTCFRR282 pKa = 11.84QVEE285 pKa = 4.42YY286 pKa = 11.18AGVLANAQNPSGAQQLIDD304 pKa = 4.3FLLSDD309 pKa = 4.88AVQADD314 pKa = 4.11IPGSMYY320 pKa = 9.9MYY322 pKa = 9.75PVSTAVEE329 pKa = 5.0LPQEE333 pKa = 4.2WQQWAPLAEE342 pKa = 4.45QPFEE346 pKa = 4.09VAPDD350 pKa = 4.08EE351 pKa = 4.35IAAEE355 pKa = 3.95RR356 pKa = 11.84DD357 pKa = 2.95TWLEE361 pKa = 3.74QWSDD365 pKa = 3.52TVIGG369 pKa = 3.88
Molecular weight: 38.33 kDa
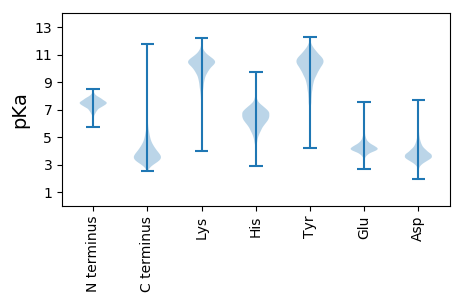
Isoelectric point according different methods:
Protein with the highest isoelectric point:
>tr|F8A379|F8A379_CELGA Inner-membrane translocator OS=Cellulomonas gilvus (strain ATCC 13127 / NRRL B-14078) OX=593907 GN=Celgi_2573 PE=4 SV=1
MM1 pKa = 7.4GSVIKK6 pKa = 10.42KK7 pKa = 8.47RR8 pKa = 11.84RR9 pKa = 11.84KK10 pKa = 9.22RR11 pKa = 11.84MAKK14 pKa = 9.41KK15 pKa = 9.87KK16 pKa = 9.7HH17 pKa = 5.84RR18 pKa = 11.84KK19 pKa = 8.56LLRR22 pKa = 11.84KK23 pKa = 7.78TRR25 pKa = 11.84HH26 pKa = 3.65QRR28 pKa = 11.84RR29 pKa = 11.84NKK31 pKa = 9.78KK32 pKa = 9.85
MM1 pKa = 7.4GSVIKK6 pKa = 10.42KK7 pKa = 8.47RR8 pKa = 11.84RR9 pKa = 11.84KK10 pKa = 9.22RR11 pKa = 11.84MAKK14 pKa = 9.41KK15 pKa = 9.87KK16 pKa = 9.7HH17 pKa = 5.84RR18 pKa = 11.84KK19 pKa = 8.56LLRR22 pKa = 11.84KK23 pKa = 7.78TRR25 pKa = 11.84HH26 pKa = 3.65QRR28 pKa = 11.84RR29 pKa = 11.84NKK31 pKa = 9.78KK32 pKa = 9.85
Molecular weight: 4.08 kDa
Isoelectric point according different methods:
Peptides (in silico digests for buttom-up proteomics)
Below you can find in silico digests of the whole proteome with Trypsin, Chymotrypsin, Trypsin+LysC, LysN, ArgC proteases suitable for different mass spec machines.| Try ESI |
 |
|---|
| ChTry ESI |
 |
|---|
| ArgC ESI |
 |
|---|
| LysN ESI |
 |
|---|
| TryLysC ESI |
 |
|---|
| Try MALDI |
 |
|---|
| ChTry MALDI |
 |
|---|
| ArgC MALDI |
 |
|---|
| LysN MALDI |
 |
|---|
| TryLysC MALDI |
 |
|---|
| Try LTQ |
 |
|---|
| ChTry LTQ |
 |
|---|
| ArgC LTQ |
 |
|---|
| LysN LTQ |
 |
|---|
| TryLysC LTQ |
 |
|---|
| Try MSlow |
 |
|---|
| ChTry MSlow |
 |
|---|
| ArgC MSlow |
 |
|---|
| LysN MSlow |
 |
|---|
| TryLysC MSlow |
 |
|---|
| Try MShigh |
 |
|---|
| ChTry MShigh |
 |
|---|
| ArgC MShigh |
 |
|---|
| LysN MShigh |
 |
|---|
| TryLysC MShigh |
 |
|---|
General Statistics
Number of major isoforms |
Number of additional isoforms |
Number of all proteins |
Number of amino acids |
Min. Seq. Length |
Max. Seq. Length |
Avg. Seq. Length |
Avg. Mol. Weight |
|---|---|---|---|---|---|---|---|
0 |
1067109 |
32 |
2381 |
338.4 |
35.83 |
Amino acid frequency
Ala |
Cys |
Asp |
Glu |
Phe |
Gly |
His |
Ile |
Lys |
Leu |
|---|---|---|---|---|---|---|---|---|---|
14.937 ± 0.076 | 0.567 ± 0.01 |
6.487 ± 0.032 | 5.105 ± 0.048 |
2.421 ± 0.025 | 9.24 ± 0.038 |
2.142 ± 0.023 | 2.767 ± 0.035 |
1.418 ± 0.029 | 10.214 ± 0.054 |
Met |
Asn |
Gln |
Pro |
Arg |
Ser |
Thr |
Val |
Trp |
Tyr |
|---|---|---|---|---|---|---|---|---|---|
1.505 ± 0.017 | 1.4 ± 0.025 |
6.03 ± 0.043 | 2.782 ± 0.024 |
7.941 ± 0.051 | 4.814 ± 0.032 |
6.56 ± 0.056 | 10.312 ± 0.044 |
1.586 ± 0.02 | 1.774 ± 0.022 |
Most of the basic statistics you can see at this page can be downloaded from this CSV file
Proteome-pI is available under Creative Commons Attribution-NoDerivs license, for more details see here
| Reference: Kozlowski LP. Proteome-pI 2.0: Proteome Isoelectric Point Database Update. Nucleic Acids Res. 2021, doi: 10.1093/nar/gkab944 | Contact: Lukasz P. Kozlowski |
