Tortoise microvirus 81
Taxonomy: Viruses; Monodnaviria; Sangervirae; Phixviricota; Malgrandaviricetes; Petitvirales; Microviridae; unclassified Microviridae
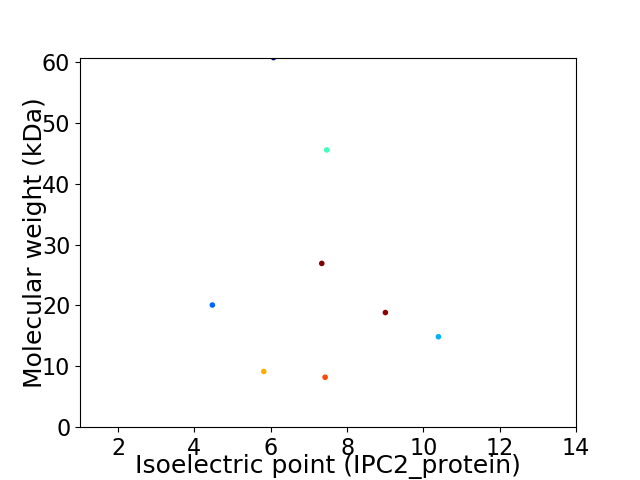
Average proteome isoelectric point is 7.12
Get precalculated fractions of proteins

Virtual 2D-PAGE plot for 8 proteins (isoelectric point calculated using IPC2_protein)
Get csv file with sequences according to given criteria:
* You can choose from 21 different methods for calculating isoelectric point
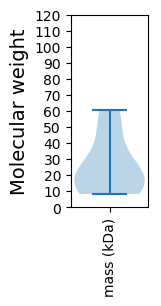
Summary statistics related to proteome-wise predictions


Protein with the lowest isoelectric point:
>tr|A0A4P8W6Y4|A0A4P8W6Y4_9VIRU Major capsid protein OS=Tortoise microvirus 81 OX=2583189 PE=4 SV=1
MM1 pKa = 7.93AYY3 pKa = 10.41YY4 pKa = 10.16DD5 pKa = 4.56LKK7 pKa = 11.21SISDD11 pKa = 3.63WGVVASGEE19 pKa = 4.18FHH21 pKa = 7.77DD22 pKa = 5.92LPFNNGRR29 pKa = 11.84TTFNRR34 pKa = 11.84TIITSHH40 pKa = 5.41EE41 pKa = 4.17VFVQVQGLNVDD52 pKa = 3.94PEE54 pKa = 4.47SGEE57 pKa = 4.0VFAPLDD63 pKa = 3.51FFMTVPPGMHH73 pKa = 7.4DD74 pKa = 3.26LTFNLDD80 pKa = 3.86QPAKK84 pKa = 9.01WGWYY88 pKa = 7.45LQPGAPADD96 pKa = 3.49GANYY100 pKa = 9.92VRR102 pKa = 11.84FRR104 pKa = 11.84NNIRR108 pKa = 11.84DD109 pKa = 3.78QVIVPPAEE117 pKa = 4.9DD118 pKa = 3.48SLTTIEE124 pKa = 4.09PAAPRR129 pKa = 11.84NLEE132 pKa = 3.79ADD134 pKa = 4.0RR135 pKa = 11.84QAMLQRR141 pKa = 11.84YY142 pKa = 8.11NLAMLQRR149 pKa = 11.84TLNEE153 pKa = 3.77EE154 pKa = 3.89LDD156 pKa = 3.4ALRR159 pKa = 11.84AQRR162 pKa = 11.84AAAAEE167 pKa = 4.14APPVVEE173 pKa = 5.01DD174 pKa = 4.03TPEE177 pKa = 4.22GQSS180 pKa = 3.1
MM1 pKa = 7.93AYY3 pKa = 10.41YY4 pKa = 10.16DD5 pKa = 4.56LKK7 pKa = 11.21SISDD11 pKa = 3.63WGVVASGEE19 pKa = 4.18FHH21 pKa = 7.77DD22 pKa = 5.92LPFNNGRR29 pKa = 11.84TTFNRR34 pKa = 11.84TIITSHH40 pKa = 5.41EE41 pKa = 4.17VFVQVQGLNVDD52 pKa = 3.94PEE54 pKa = 4.47SGEE57 pKa = 4.0VFAPLDD63 pKa = 3.51FFMTVPPGMHH73 pKa = 7.4DD74 pKa = 3.26LTFNLDD80 pKa = 3.86QPAKK84 pKa = 9.01WGWYY88 pKa = 7.45LQPGAPADD96 pKa = 3.49GANYY100 pKa = 9.92VRR102 pKa = 11.84FRR104 pKa = 11.84NNIRR108 pKa = 11.84DD109 pKa = 3.78QVIVPPAEE117 pKa = 4.9DD118 pKa = 3.48SLTTIEE124 pKa = 4.09PAAPRR129 pKa = 11.84NLEE132 pKa = 3.79ADD134 pKa = 4.0RR135 pKa = 11.84QAMLQRR141 pKa = 11.84YY142 pKa = 8.11NLAMLQRR149 pKa = 11.84TLNEE153 pKa = 3.77EE154 pKa = 3.89LDD156 pKa = 3.4ALRR159 pKa = 11.84AQRR162 pKa = 11.84AAAAEE167 pKa = 4.14APPVVEE173 pKa = 5.01DD174 pKa = 4.03TPEE177 pKa = 4.22GQSS180 pKa = 3.1
Molecular weight: 20.08 kDa
Isoelectric point according different methods:
Protein with the highest isoelectric point:
>tr|A0A4P8W7S8|A0A4P8W7S8_9VIRU Uncharacterized protein OS=Tortoise microvirus 81 OX=2583189 PE=4 SV=1
MM1 pKa = 7.91RR2 pKa = 11.84RR3 pKa = 11.84RR4 pKa = 11.84TYY6 pKa = 11.03PMARR10 pKa = 11.84KK11 pKa = 9.45GKK13 pKa = 10.03RR14 pKa = 11.84NRR16 pKa = 11.84TQKK19 pKa = 7.28TTVRR23 pKa = 11.84AGGQTLTATVVRR35 pKa = 11.84ATPEE39 pKa = 3.55PMKK42 pKa = 10.2PRR44 pKa = 11.84RR45 pKa = 11.84SLTLARR51 pKa = 11.84DD52 pKa = 3.58RR53 pKa = 11.84DD54 pKa = 4.05AGAHH58 pKa = 4.69VPRR61 pKa = 11.84TISPAPFAVPAVATRR76 pKa = 11.84TTRR79 pKa = 11.84DD80 pKa = 2.74IQAQQKK86 pKa = 9.68AVKK89 pKa = 9.42QRR91 pKa = 11.84RR92 pKa = 11.84AAQNTQQDD100 pKa = 3.92NPSSKK105 pKa = 9.31RR106 pKa = 11.84TRR108 pKa = 11.84GVCKK112 pKa = 9.55PQPDD116 pKa = 3.8PAKK119 pKa = 10.25APRR122 pKa = 11.84GGGGSRR128 pKa = 11.84PFVPWCLL135 pKa = 3.44
MM1 pKa = 7.91RR2 pKa = 11.84RR3 pKa = 11.84RR4 pKa = 11.84TYY6 pKa = 11.03PMARR10 pKa = 11.84KK11 pKa = 9.45GKK13 pKa = 10.03RR14 pKa = 11.84NRR16 pKa = 11.84TQKK19 pKa = 7.28TTVRR23 pKa = 11.84AGGQTLTATVVRR35 pKa = 11.84ATPEE39 pKa = 3.55PMKK42 pKa = 10.2PRR44 pKa = 11.84RR45 pKa = 11.84SLTLARR51 pKa = 11.84DD52 pKa = 3.58RR53 pKa = 11.84DD54 pKa = 4.05AGAHH58 pKa = 4.69VPRR61 pKa = 11.84TISPAPFAVPAVATRR76 pKa = 11.84TTRR79 pKa = 11.84DD80 pKa = 2.74IQAQQKK86 pKa = 9.68AVKK89 pKa = 9.42QRR91 pKa = 11.84RR92 pKa = 11.84AAQNTQQDD100 pKa = 3.92NPSSKK105 pKa = 9.31RR106 pKa = 11.84TRR108 pKa = 11.84GVCKK112 pKa = 9.55PQPDD116 pKa = 3.8PAKK119 pKa = 10.25APRR122 pKa = 11.84GGGGSRR128 pKa = 11.84PFVPWCLL135 pKa = 3.44
Molecular weight: 14.86 kDa
Isoelectric point according different methods:
Peptides (in silico digests for buttom-up proteomics)
Below you can find in silico digests of the whole proteome with Trypsin, Chymotrypsin, Trypsin+LysC, LysN, ArgC proteases suitable for different mass spec machines.| Try ESI |
 |
|---|
| ChTry ESI |
 |
|---|
| ArgC ESI |
 |
|---|
| LysN ESI |
 |
|---|
| TryLysC ESI |
 |
|---|
| Try MALDI |
 |
|---|
| ChTry MALDI |
 |
|---|
| ArgC MALDI |
 |
|---|
| LysN MALDI |
 |
|---|
| TryLysC MALDI |
 |
|---|
| Try LTQ |
 |
|---|
| ChTry LTQ |
 |
|---|
| ArgC LTQ |
 |
|---|
| LysN LTQ |
 |
|---|
| TryLysC LTQ |
 |
|---|
| Try MSlow |
 |
|---|
| ChTry MSlow |
 |
|---|
| ArgC MSlow |
 |
|---|
| LysN MSlow |
 |
|---|
| TryLysC MSlow |
 |
|---|
| Try MShigh |
 |
|---|
| ChTry MShigh |
 |
|---|
| ArgC MShigh |
 |
|---|
| LysN MShigh |
 |
|---|
| TryLysC MShigh |
 |
|---|
General Statistics
Number of major isoforms |
Number of additional isoforms |
Number of all proteins |
Number of amino acids |
Min. Seq. Length |
Max. Seq. Length |
Avg. Seq. Length |
Avg. Mol. Weight |
|---|---|---|---|---|---|---|---|
0 |
1833 |
74 |
539 |
229.1 |
25.54 |
Amino acid frequency
Ala |
Cys |
Asp |
Glu |
Phe |
Gly |
His |
Ile |
Lys |
Leu |
|---|---|---|---|---|---|---|---|---|---|
9.274 ± 0.894 | 0.927 ± 0.428 |
5.292 ± 0.624 | 6.219 ± 0.563 |
4.255 ± 0.443 | 8.238 ± 1.421 |
2.019 ± 0.277 | 4.474 ± 0.428 |
4.801 ± 0.56 | 7.256 ± 0.9 |
Met |
Asn |
Gln |
Pro |
Arg |
Ser |
Thr |
Val |
Trp |
Tyr |
|---|---|---|---|---|---|---|---|---|---|
2.346 ± 0.233 | 4.146 ± 0.595 |
6.11 ± 0.64 | 3.71 ± 0.463 |
7.911 ± 0.855 | 5.237 ± 0.858 |
6.274 ± 0.618 | 6.765 ± 0.691 |
1.582 ± 0.324 | 3.164 ± 0.715 |
Most of the basic statistics you can see at this page can be downloaded from this CSV file
Proteome-pI is available under Creative Commons Attribution-NoDerivs license, for more details see here
| Reference: Kozlowski LP. Proteome-pI 2.0: Proteome Isoelectric Point Database Update. Nucleic Acids Res. 2021, doi: 10.1093/nar/gkab944 | Contact: Lukasz P. Kozlowski |
