Paraburkholderia fungorum
Taxonomy:
Average proteome isoelectric point is 6.67
Get precalculated fractions of proteins

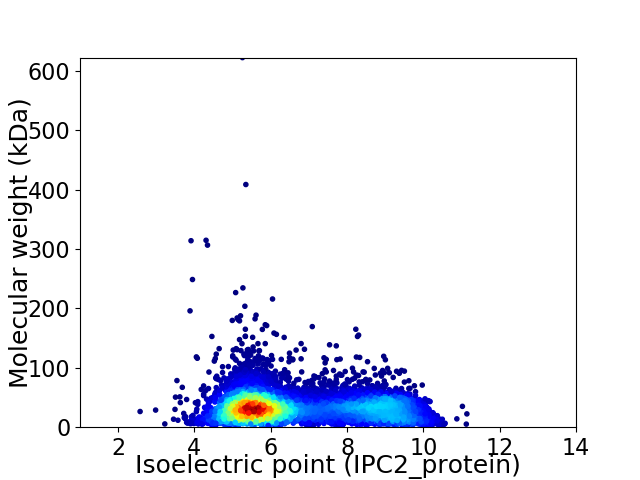
Virtual 2D-PAGE plot for 7450 proteins (isoelectric point calculated using IPC2_protein)
Get csv file with sequences according to given criteria:
* You can choose from 21 different methods for calculating isoelectric point
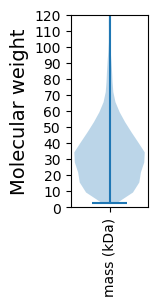
Summary statistics related to proteome-wise predictions


Protein with the lowest isoelectric point:
>tr|A0A1H1IWB0|A0A1H1IWB0_9BURK Threonine/homoserine/homoserine lactone efflux protein OS=Paraburkholderia fungorum OX=134537 GN=SAMN05443245_5765 PE=4 SV=1
MM1 pKa = 8.02DD2 pKa = 4.46NFYY5 pKa = 10.6IAATSTSPEE14 pKa = 3.24VDD16 pKa = 3.72FRR18 pKa = 11.84FDD20 pKa = 3.74QNVLTLRR27 pKa = 11.84GEE29 pKa = 4.49SYY31 pKa = 10.68PEE33 pKa = 3.49NAAAFYY39 pKa = 11.02APVIEE44 pKa = 4.42QLRR47 pKa = 11.84TYY49 pKa = 10.83LAGCNDD55 pKa = 3.07SSITVDD61 pKa = 3.16VTLTYY66 pKa = 10.64FNSSSTKK73 pKa = 9.07MLFSVFDD80 pKa = 4.41ALDD83 pKa = 3.69EE84 pKa = 4.47AASSGNRR91 pKa = 11.84VLVNWFRR98 pKa = 11.84DD99 pKa = 3.86AEE101 pKa = 4.31DD102 pKa = 3.41EE103 pKa = 4.51TILEE107 pKa = 4.4FGEE110 pKa = 4.02EE111 pKa = 3.93LQADD115 pKa = 4.73FTAIQFTDD123 pKa = 4.02CPVATT128 pKa = 4.69
MM1 pKa = 8.02DD2 pKa = 4.46NFYY5 pKa = 10.6IAATSTSPEE14 pKa = 3.24VDD16 pKa = 3.72FRR18 pKa = 11.84FDD20 pKa = 3.74QNVLTLRR27 pKa = 11.84GEE29 pKa = 4.49SYY31 pKa = 10.68PEE33 pKa = 3.49NAAAFYY39 pKa = 11.02APVIEE44 pKa = 4.42QLRR47 pKa = 11.84TYY49 pKa = 10.83LAGCNDD55 pKa = 3.07SSITVDD61 pKa = 3.16VTLTYY66 pKa = 10.64FNSSSTKK73 pKa = 9.07MLFSVFDD80 pKa = 4.41ALDD83 pKa = 3.69EE84 pKa = 4.47AASSGNRR91 pKa = 11.84VLVNWFRR98 pKa = 11.84DD99 pKa = 3.86AEE101 pKa = 4.31DD102 pKa = 3.41EE103 pKa = 4.51TILEE107 pKa = 4.4FGEE110 pKa = 4.02EE111 pKa = 3.93LQADD115 pKa = 4.73FTAIQFTDD123 pKa = 4.02CPVATT128 pKa = 4.69
Molecular weight: 14.26 kDa
Isoelectric point according different methods:
Protein with the highest isoelectric point:
>tr|A0A1H1CHG1|A0A1H1CHG1_9BURK Hydroxymethylpyrimidine kinase /phosphomethylpyrimidine kinase OS=Paraburkholderia fungorum OX=134537 GN=SAMN05443245_2154 PE=4 SV=1
MM1 pKa = 6.8MASGRR6 pKa = 11.84RR7 pKa = 11.84VVLVTARR14 pKa = 11.84RR15 pKa = 11.84VVMTAIVVRR24 pKa = 11.84VVTLGIVPSEE34 pKa = 3.7RR35 pKa = 11.84HH36 pKa = 5.27AASKK40 pKa = 10.23VVQIVASALRR50 pKa = 11.84VALVTVRR57 pKa = 11.84RR58 pKa = 11.84VATRR62 pKa = 11.84ATVVRR67 pKa = 11.84AVTLGIAPNALRR79 pKa = 11.84AASATVRR86 pKa = 11.84RR87 pKa = 11.84VVMKK91 pKa = 9.64VIVVRR96 pKa = 11.84VVTPVIAPTGLRR108 pKa = 11.84AASVTVRR115 pKa = 11.84RR116 pKa = 11.84VAMKK120 pKa = 9.9VIVVRR125 pKa = 11.84AVTSVIAPSALRR137 pKa = 11.84AASVTVRR144 pKa = 11.84RR145 pKa = 11.84VVMTTAVRR153 pKa = 11.84AVTPVIAPNALRR165 pKa = 11.84VASATARR172 pKa = 11.84PVVMTAIVVRR182 pKa = 11.84VVTPVIAPNAHH193 pKa = 6.29PAVSKK198 pKa = 10.87AVASALRR205 pKa = 11.84VVTTANVARR214 pKa = 11.84SAARR218 pKa = 11.84ARR220 pKa = 11.84AMAVRR225 pKa = 11.84PKK227 pKa = 10.35AVRR230 pKa = 11.84AAAIAPVSATTAVPRR245 pKa = 11.84RR246 pKa = 11.84IAVAAKK252 pKa = 9.95ARR254 pKa = 11.84RR255 pKa = 11.84AASKK259 pKa = 10.84ANAVRR264 pKa = 11.84PSVANALPAASTNRR278 pKa = 11.84CRR280 pKa = 11.84PRR282 pKa = 11.84RR283 pKa = 11.84AVSATTVRR291 pKa = 11.84HH292 pKa = 5.55EE293 pKa = 4.15PTNRR297 pKa = 11.84AARR300 pKa = 11.84HH301 pKa = 5.68PLPVPNAVSLTTTTPHH317 pKa = 6.7RR318 pKa = 11.84ARR320 pKa = 11.84RR321 pKa = 11.84VAIMKK326 pKa = 7.74TRR328 pKa = 11.84RR329 pKa = 11.84ACCVCRR335 pKa = 11.84NN336 pKa = 3.55
MM1 pKa = 6.8MASGRR6 pKa = 11.84RR7 pKa = 11.84VVLVTARR14 pKa = 11.84RR15 pKa = 11.84VVMTAIVVRR24 pKa = 11.84VVTLGIVPSEE34 pKa = 3.7RR35 pKa = 11.84HH36 pKa = 5.27AASKK40 pKa = 10.23VVQIVASALRR50 pKa = 11.84VALVTVRR57 pKa = 11.84RR58 pKa = 11.84VATRR62 pKa = 11.84ATVVRR67 pKa = 11.84AVTLGIAPNALRR79 pKa = 11.84AASATVRR86 pKa = 11.84RR87 pKa = 11.84VVMKK91 pKa = 9.64VIVVRR96 pKa = 11.84VVTPVIAPTGLRR108 pKa = 11.84AASVTVRR115 pKa = 11.84RR116 pKa = 11.84VAMKK120 pKa = 9.9VIVVRR125 pKa = 11.84AVTSVIAPSALRR137 pKa = 11.84AASVTVRR144 pKa = 11.84RR145 pKa = 11.84VVMTTAVRR153 pKa = 11.84AVTPVIAPNALRR165 pKa = 11.84VASATARR172 pKa = 11.84PVVMTAIVVRR182 pKa = 11.84VVTPVIAPNAHH193 pKa = 6.29PAVSKK198 pKa = 10.87AVASALRR205 pKa = 11.84VVTTANVARR214 pKa = 11.84SAARR218 pKa = 11.84ARR220 pKa = 11.84AMAVRR225 pKa = 11.84PKK227 pKa = 10.35AVRR230 pKa = 11.84AAAIAPVSATTAVPRR245 pKa = 11.84RR246 pKa = 11.84IAVAAKK252 pKa = 9.95ARR254 pKa = 11.84RR255 pKa = 11.84AASKK259 pKa = 10.84ANAVRR264 pKa = 11.84PSVANALPAASTNRR278 pKa = 11.84CRR280 pKa = 11.84PRR282 pKa = 11.84RR283 pKa = 11.84AVSATTVRR291 pKa = 11.84HH292 pKa = 5.55EE293 pKa = 4.15PTNRR297 pKa = 11.84AARR300 pKa = 11.84HH301 pKa = 5.68PLPVPNAVSLTTTTPHH317 pKa = 6.7RR318 pKa = 11.84ARR320 pKa = 11.84RR321 pKa = 11.84VAIMKK326 pKa = 7.74TRR328 pKa = 11.84RR329 pKa = 11.84ACCVCRR335 pKa = 11.84NN336 pKa = 3.55
Molecular weight: 35.1 kDa
Isoelectric point according different methods:
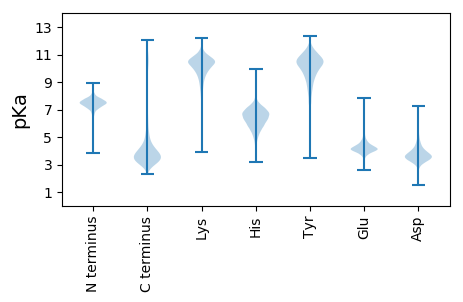
Peptides (in silico digests for buttom-up proteomics)
Below you can find in silico digests of the whole proteome with Trypsin, Chymotrypsin, Trypsin+LysC, LysN, ArgC proteases suitable for different mass spec machines.| Try ESI |
 |
|---|
| ChTry ESI |
 |
|---|
| ArgC ESI |
 |
|---|
| LysN ESI |
 |
|---|
| TryLysC ESI |
 |
|---|
| Try MALDI |
 |
|---|
| ChTry MALDI |
 |
|---|
| ArgC MALDI |
 |
|---|
| LysN MALDI |
 |
|---|
| TryLysC MALDI |
 |
|---|
| Try LTQ |
 |
|---|
| ChTry LTQ |
 |
|---|
| ArgC LTQ |
 |
|---|
| LysN LTQ |
 |
|---|
| TryLysC LTQ |
 |
|---|
| Try MSlow |
 |
|---|
| ChTry MSlow |
 |
|---|
| ArgC MSlow |
 |
|---|
| LysN MSlow |
 |
|---|
| TryLysC MSlow |
 |
|---|
| Try MShigh |
 |
|---|
| ChTry MShigh |
 |
|---|
| ArgC MShigh |
 |
|---|
| LysN MShigh |
 |
|---|
| TryLysC MShigh |
 |
|---|
General Statistics
Number of major isoforms |
Number of additional isoforms |
Number of all proteins |
Number of amino acids |
Min. Seq. Length |
Max. Seq. Length |
Avg. Seq. Length |
Avg. Mol. Weight |
|---|---|---|---|---|---|---|---|
0 |
2406725 |
29 |
5743 |
323.1 |
35.04 |
Amino acid frequency
Ala |
Cys |
Asp |
Glu |
Phe |
Gly |
His |
Ile |
Lys |
Leu |
|---|---|---|---|---|---|---|---|---|---|
12.415 ± 0.039 | 0.903 ± 0.01 |
5.444 ± 0.021 | 4.959 ± 0.03 |
3.765 ± 0.018 | 8.119 ± 0.033 |
2.279 ± 0.014 | 4.818 ± 0.021 |
3.147 ± 0.026 | 10.15 ± 0.038 |
Met |
Asn |
Gln |
Pro |
Arg |
Ser |
Thr |
Val |
Trp |
Tyr |
|---|---|---|---|---|---|---|---|---|---|
2.359 ± 0.014 | 2.991 ± 0.019 |
5.018 ± 0.022 | 3.705 ± 0.02 |
6.609 ± 0.036 | 6.123 ± 0.029 |
5.651 ± 0.03 | 7.725 ± 0.025 |
1.367 ± 0.012 | 2.452 ± 0.015 |
Most of the basic statistics you can see at this page can be downloaded from this CSV file
Proteome-pI is available under Creative Commons Attribution-NoDerivs license, for more details see here
| Reference: Kozlowski LP. Proteome-pI 2.0: Proteome Isoelectric Point Database Update. Nucleic Acids Res. 2021, doi: 10.1093/nar/gkab944 | Contact: Lukasz P. Kozlowski |
