Pseudomonas sp. S-6-2
Taxonomy: cellular organisms; Bacteria; Proteobacteria; Gammaproteobacteria; Pseudomonadales; Pseudomonadaceae; Pseudomonas; unclassified Pseudomonas
Average proteome isoelectric point is 6.15
Get precalculated fractions of proteins

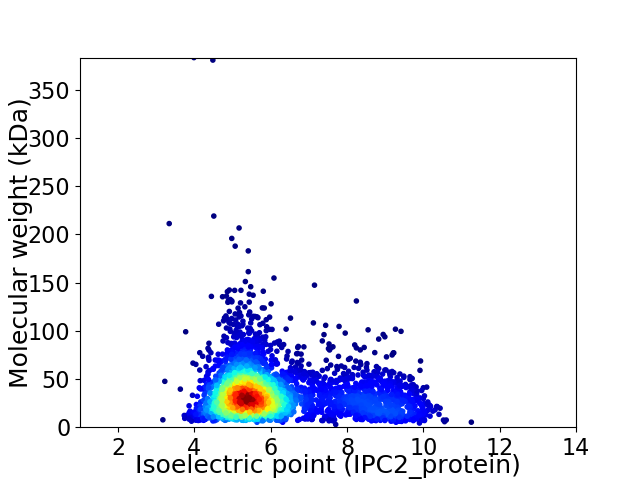
Virtual 2D-PAGE plot for 3645 proteins (isoelectric point calculated using IPC2_protein)
Get csv file with sequences according to given criteria:
* You can choose from 21 different methods for calculating isoelectric point
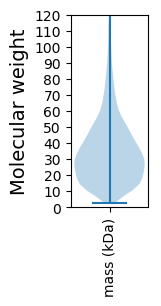
Summary statistics related to proteome-wise predictions


Protein with the lowest isoelectric point:
>tr|A0A1V0B7J6|A0A1V0B7J6_9PSED HTH araC/xylS-type domain-containing protein OS=Pseudomonas sp. S-6-2 OX=1931241 GN=BVH74_14600 PE=4 SV=1
MM1 pKa = 6.88KK2 pKa = 8.92TQRR5 pKa = 11.84VLTPLAFGLAVAISGSAYY23 pKa = 10.46AVGDD27 pKa = 3.57GASAVIYY34 pKa = 7.55DD35 pKa = 3.77TQKK38 pKa = 10.62NFNNEE43 pKa = 3.73VLNQGTEE50 pKa = 3.9NTASVNDD57 pKa = 4.1SLNSASGNVGVNVAAGDD74 pKa = 3.85NNQQANAAAVATADD88 pKa = 3.41ALFVFGFPVVASAQASIDD106 pKa = 3.79VQQKK110 pKa = 10.5AFNNDD115 pKa = 2.83LTNYY119 pKa = 9.41SVPNDD124 pKa = 3.23ASLNNSANDD133 pKa = 3.42TSGNVGINIAAGNYY147 pKa = 7.18NQQKK151 pKa = 9.92NDD153 pKa = 3.32MAIASSSSAFTAGASVNVEE172 pKa = 3.66QKK174 pKa = 11.04SFGNNTDD181 pKa = 3.19NLAVLDD187 pKa = 3.92YY188 pKa = 10.74GKK190 pKa = 10.49QYY192 pKa = 11.28VHH194 pKa = 7.05LKK196 pKa = 10.38LKK198 pKa = 10.82ADD200 pKa = 3.59GTYY203 pKa = 10.58EE204 pKa = 4.16GVSDD208 pKa = 4.7QIGDD212 pKa = 3.55VYY214 pKa = 11.25LDD216 pKa = 3.32VWEE219 pKa = 5.51GPTHH223 pKa = 6.83PGGANIGHH231 pKa = 7.14IDD233 pKa = 3.6VDD235 pKa = 4.3SAAQGAVDD243 pKa = 4.58LNGDD247 pKa = 3.84GGAFAFNEE255 pKa = 4.21EE256 pKa = 4.18GTLGLKK262 pKa = 10.62GSVSGYY268 pKa = 8.98IPVVVGFTGPVTNNATINGSLNNVSGNVGVNVAAGGGNQQSNSLAIAAGCTACPNGGGGGGEE330 pKa = 4.08LL331 pKa = 4.22
MM1 pKa = 6.88KK2 pKa = 8.92TQRR5 pKa = 11.84VLTPLAFGLAVAISGSAYY23 pKa = 10.46AVGDD27 pKa = 3.57GASAVIYY34 pKa = 7.55DD35 pKa = 3.77TQKK38 pKa = 10.62NFNNEE43 pKa = 3.73VLNQGTEE50 pKa = 3.9NTASVNDD57 pKa = 4.1SLNSASGNVGVNVAAGDD74 pKa = 3.85NNQQANAAAVATADD88 pKa = 3.41ALFVFGFPVVASAQASIDD106 pKa = 3.79VQQKK110 pKa = 10.5AFNNDD115 pKa = 2.83LTNYY119 pKa = 9.41SVPNDD124 pKa = 3.23ASLNNSANDD133 pKa = 3.42TSGNVGINIAAGNYY147 pKa = 7.18NQQKK151 pKa = 9.92NDD153 pKa = 3.32MAIASSSSAFTAGASVNVEE172 pKa = 3.66QKK174 pKa = 11.04SFGNNTDD181 pKa = 3.19NLAVLDD187 pKa = 3.92YY188 pKa = 10.74GKK190 pKa = 10.49QYY192 pKa = 11.28VHH194 pKa = 7.05LKK196 pKa = 10.38LKK198 pKa = 10.82ADD200 pKa = 3.59GTYY203 pKa = 10.58EE204 pKa = 4.16GVSDD208 pKa = 4.7QIGDD212 pKa = 3.55VYY214 pKa = 11.25LDD216 pKa = 3.32VWEE219 pKa = 5.51GPTHH223 pKa = 6.83PGGANIGHH231 pKa = 7.14IDD233 pKa = 3.6VDD235 pKa = 4.3SAAQGAVDD243 pKa = 4.58LNGDD247 pKa = 3.84GGAFAFNEE255 pKa = 4.21EE256 pKa = 4.18GTLGLKK262 pKa = 10.62GSVSGYY268 pKa = 8.98IPVVVGFTGPVTNNATINGSLNNVSGNVGVNVAAGGGNQQSNSLAIAAGCTACPNGGGGGGEE330 pKa = 4.08LL331 pKa = 4.22
Molecular weight: 33.11 kDa
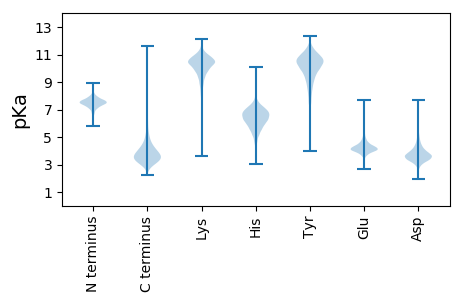
Isoelectric point according different methods:
Protein with the highest isoelectric point:
>tr|A0A1V0B2E8|A0A1V0B2E8_9PSED Uncharacterized protein OS=Pseudomonas sp. S-6-2 OX=1931241 GN=BVH74_04655 PE=4 SV=1
MM1 pKa = 7.45KK2 pKa = 9.51RR3 pKa = 11.84TFQPSVLKK11 pKa = 10.46RR12 pKa = 11.84KK13 pKa = 9.37RR14 pKa = 11.84NHH16 pKa = 5.37GFRR19 pKa = 11.84ARR21 pKa = 11.84MATKK25 pKa = 10.4NGRR28 pKa = 11.84QVLARR33 pKa = 11.84RR34 pKa = 11.84RR35 pKa = 11.84AKK37 pKa = 9.93GRR39 pKa = 11.84KK40 pKa = 8.85RR41 pKa = 11.84LSAA44 pKa = 3.96
MM1 pKa = 7.45KK2 pKa = 9.51RR3 pKa = 11.84TFQPSVLKK11 pKa = 10.46RR12 pKa = 11.84KK13 pKa = 9.37RR14 pKa = 11.84NHH16 pKa = 5.37GFRR19 pKa = 11.84ARR21 pKa = 11.84MATKK25 pKa = 10.4NGRR28 pKa = 11.84QVLARR33 pKa = 11.84RR34 pKa = 11.84RR35 pKa = 11.84AKK37 pKa = 9.93GRR39 pKa = 11.84KK40 pKa = 8.85RR41 pKa = 11.84LSAA44 pKa = 3.96
Molecular weight: 5.22 kDa
Isoelectric point according different methods:
Peptides (in silico digests for buttom-up proteomics)
Below you can find in silico digests of the whole proteome with Trypsin, Chymotrypsin, Trypsin+LysC, LysN, ArgC proteases suitable for different mass spec machines.| Try ESI |
 |
|---|
| ChTry ESI |
 |
|---|
| ArgC ESI |
 |
|---|
| LysN ESI |
 |
|---|
| TryLysC ESI |
 |
|---|
| Try MALDI |
 |
|---|
| ChTry MALDI |
 |
|---|
| ArgC MALDI |
 |
|---|
| LysN MALDI |
 |
|---|
| TryLysC MALDI |
 |
|---|
| Try LTQ |
 |
|---|
| ChTry LTQ |
 |
|---|
| ArgC LTQ |
 |
|---|
| LysN LTQ |
 |
|---|
| TryLysC LTQ |
 |
|---|
| Try MSlow |
 |
|---|
| ChTry MSlow |
 |
|---|
| ArgC MSlow |
 |
|---|
| LysN MSlow |
 |
|---|
| TryLysC MSlow |
 |
|---|
| Try MShigh |
 |
|---|
| ChTry MShigh |
 |
|---|
| ArgC MShigh |
 |
|---|
| LysN MShigh |
 |
|---|
| TryLysC MShigh |
 |
|---|
General Statistics
Number of major isoforms |
Number of additional isoforms |
Number of all proteins |
Number of amino acids |
Min. Seq. Length |
Max. Seq. Length |
Avg. Seq. Length |
Avg. Mol. Weight |
|---|---|---|---|---|---|---|---|
0 |
1217832 |
23 |
3849 |
334.1 |
36.77 |
Amino acid frequency
Ala |
Cys |
Asp |
Glu |
Phe |
Gly |
His |
Ile |
Lys |
Leu |
|---|---|---|---|---|---|---|---|---|---|
10.757 ± 0.045 | 0.999 ± 0.013 |
5.399 ± 0.031 | 6.056 ± 0.038 |
3.489 ± 0.023 | 7.931 ± 0.045 |
2.289 ± 0.022 | 4.854 ± 0.031 |
2.902 ± 0.035 | 12.03 ± 0.059 |
Met |
Asn |
Gln |
Pro |
Arg |
Ser |
Thr |
Val |
Trp |
Tyr |
|---|---|---|---|---|---|---|---|---|---|
2.378 ± 0.019 | 3.013 ± 0.033 |
4.849 ± 0.032 | 5.005 ± 0.037 |
6.817 ± 0.042 | 5.723 ± 0.033 |
4.576 ± 0.027 | 6.956 ± 0.037 |
1.472 ± 0.02 | 2.505 ± 0.019 |
Most of the basic statistics you can see at this page can be downloaded from this CSV file
Proteome-pI is available under Creative Commons Attribution-NoDerivs license, for more details see here
| Reference: Kozlowski LP. Proteome-pI 2.0: Proteome Isoelectric Point Database Update. Nucleic Acids Res. 2021, doi: 10.1093/nar/gkab944 | Contact: Lukasz P. Kozlowski |
