Grapevine red blotch virus
Taxonomy: Viruses; Monodnaviria; Shotokuvirae; Cressdnaviricota; Repensiviricetes; Geplafuvirales; Geminiviridae; Grablovirus
Average proteome isoelectric point is 6.55
Get precalculated fractions of proteins

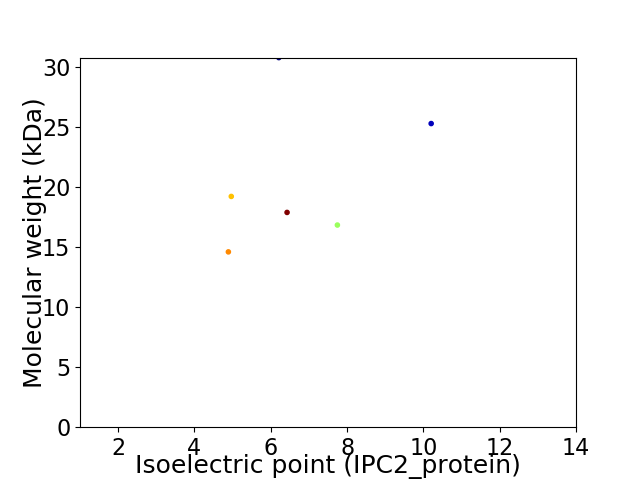
Virtual 2D-PAGE plot for 6 proteins (isoelectric point calculated using IPC2_protein)
Get csv file with sequences according to given criteria:
* You can choose from 21 different methods for calculating isoelectric point
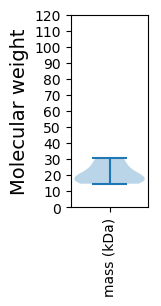
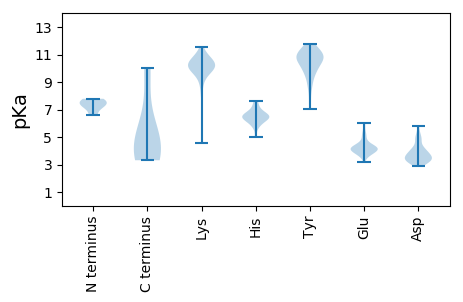
Summary statistics related to proteome-wise predictions


Protein with the lowest isoelectric point:
>tr|S5TCQ6|S5TCQ6_9GEMI C3 OS=Grapevine red blotch virus OX=1381007 GN=C3 PE=4 SV=1
MM1 pKa = 6.59VTLNKK6 pKa = 9.91RR7 pKa = 11.84NRR9 pKa = 11.84VLPEE13 pKa = 4.23CDD15 pKa = 3.04SCSSSEE21 pKa = 4.41SSLNDD26 pKa = 3.1IDD28 pKa = 4.91ICGDD32 pKa = 3.54DD33 pKa = 5.24DD34 pKa = 4.85GLGDD38 pKa = 3.74EE39 pKa = 5.23ALDD42 pKa = 4.0AGSVYY47 pKa = 10.77SSSQKK52 pKa = 10.87LLVSVAKK59 pKa = 10.56DD60 pKa = 3.46VLLDD64 pKa = 4.35DD65 pKa = 5.14CDD67 pKa = 3.91STILDD72 pKa = 3.4ISLPSALWFLSQRR85 pKa = 11.84YY86 pKa = 7.02LTCCLRR92 pKa = 11.84KK93 pKa = 9.59EE94 pKa = 4.09LLPLPGISEE103 pKa = 4.25KK104 pKa = 9.8QTVLLRR110 pKa = 11.84QLIRR114 pKa = 11.84RR115 pKa = 11.84VARR118 pKa = 11.84RR119 pKa = 11.84HH120 pKa = 5.76CLFTYY125 pKa = 9.95KK126 pKa = 10.49CEE128 pKa = 3.96EE129 pKa = 4.08WFEE132 pKa = 4.23GCLKK136 pKa = 10.31IKK138 pKa = 10.65KK139 pKa = 9.9DD140 pKa = 3.61GNEE143 pKa = 3.98KK144 pKa = 10.55KK145 pKa = 10.42EE146 pKa = 4.13PPTEE150 pKa = 4.14AEE152 pKa = 5.31KK153 pKa = 10.7KK154 pKa = 10.54AQDD157 pKa = 3.45DD158 pKa = 3.72WEE160 pKa = 4.41EE161 pKa = 4.05FCRR164 pKa = 11.84KK165 pKa = 9.05AACSASS171 pKa = 3.31
MM1 pKa = 6.59VTLNKK6 pKa = 9.91RR7 pKa = 11.84NRR9 pKa = 11.84VLPEE13 pKa = 4.23CDD15 pKa = 3.04SCSSSEE21 pKa = 4.41SSLNDD26 pKa = 3.1IDD28 pKa = 4.91ICGDD32 pKa = 3.54DD33 pKa = 5.24DD34 pKa = 4.85GLGDD38 pKa = 3.74EE39 pKa = 5.23ALDD42 pKa = 4.0AGSVYY47 pKa = 10.77SSSQKK52 pKa = 10.87LLVSVAKK59 pKa = 10.56DD60 pKa = 3.46VLLDD64 pKa = 4.35DD65 pKa = 5.14CDD67 pKa = 3.91STILDD72 pKa = 3.4ISLPSALWFLSQRR85 pKa = 11.84YY86 pKa = 7.02LTCCLRR92 pKa = 11.84KK93 pKa = 9.59EE94 pKa = 4.09LLPLPGISEE103 pKa = 4.25KK104 pKa = 9.8QTVLLRR110 pKa = 11.84QLIRR114 pKa = 11.84RR115 pKa = 11.84VARR118 pKa = 11.84RR119 pKa = 11.84HH120 pKa = 5.76CLFTYY125 pKa = 9.95KK126 pKa = 10.49CEE128 pKa = 3.96EE129 pKa = 4.08WFEE132 pKa = 4.23GCLKK136 pKa = 10.31IKK138 pKa = 10.65KK139 pKa = 9.9DD140 pKa = 3.61GNEE143 pKa = 3.98KK144 pKa = 10.55KK145 pKa = 10.42EE146 pKa = 4.13PPTEE150 pKa = 4.14AEE152 pKa = 5.31KK153 pKa = 10.7KK154 pKa = 10.54AQDD157 pKa = 3.45DD158 pKa = 3.72WEE160 pKa = 4.41EE161 pKa = 4.05FCRR164 pKa = 11.84KK165 pKa = 9.05AACSASS171 pKa = 3.31
Molecular weight: 19.21 kDa
Isoelectric point according different methods:
Protein with the highest isoelectric point:
>tr|S5TLE1|S5TLE1_9GEMI Replication-associated protein OS=Grapevine red blotch virus OX=1381007 GN=C1 PE=3 SV=1
MM1 pKa = 7.23VMKK4 pKa = 10.42KK5 pKa = 10.13RR6 pKa = 11.84SRR8 pKa = 11.84QRR10 pKa = 11.84KK11 pKa = 4.54QRR13 pKa = 11.84RR14 pKa = 11.84RR15 pKa = 11.84RR16 pKa = 11.84RR17 pKa = 11.84TTGRR21 pKa = 11.84SSAVRR26 pKa = 11.84RR27 pKa = 11.84RR28 pKa = 11.84ARR30 pKa = 11.84PRR32 pKa = 11.84SRR34 pKa = 11.84PCQFAFHH41 pKa = 6.71GNSFGGTPSLFFLTPIALGTGAEE64 pKa = 4.27DD65 pKa = 3.18RR66 pKa = 11.84TGPVLTVSSMYY77 pKa = 10.79LKK79 pKa = 10.86GVVLPSDD86 pKa = 3.44NVTDD90 pKa = 4.3GLHH93 pKa = 7.49DD94 pKa = 3.64IYY96 pKa = 11.1FWIILDD102 pKa = 4.21RR103 pKa = 11.84FPTGTDD109 pKa = 3.31PSVSDD114 pKa = 3.88IFTGSDD120 pKa = 2.91NSGSMIEE127 pKa = 4.08TLTRR131 pKa = 11.84NRR133 pKa = 11.84LNRR136 pKa = 11.84KK137 pKa = 8.14RR138 pKa = 11.84FRR140 pKa = 11.84ILGSKK145 pKa = 9.98KK146 pKa = 10.47LVVGVNKK153 pKa = 10.1KK154 pKa = 8.96PQEE157 pKa = 4.26SLPHH161 pKa = 5.69SRR163 pKa = 11.84AAFNIFQRR171 pKa = 11.84RR172 pKa = 11.84RR173 pKa = 11.84LVVAFKK179 pKa = 11.03NDD181 pKa = 3.04VSGGGRR187 pKa = 11.84NDD189 pKa = 3.11VEE191 pKa = 4.33RR192 pKa = 11.84NRR194 pKa = 11.84IYY196 pKa = 11.03LSAASASGHH205 pKa = 4.99TFRR208 pKa = 11.84LYY210 pKa = 11.35LNGIVNFYY218 pKa = 10.81NGVIFQQ224 pKa = 3.96
MM1 pKa = 7.23VMKK4 pKa = 10.42KK5 pKa = 10.13RR6 pKa = 11.84SRR8 pKa = 11.84QRR10 pKa = 11.84KK11 pKa = 4.54QRR13 pKa = 11.84RR14 pKa = 11.84RR15 pKa = 11.84RR16 pKa = 11.84RR17 pKa = 11.84TTGRR21 pKa = 11.84SSAVRR26 pKa = 11.84RR27 pKa = 11.84RR28 pKa = 11.84ARR30 pKa = 11.84PRR32 pKa = 11.84SRR34 pKa = 11.84PCQFAFHH41 pKa = 6.71GNSFGGTPSLFFLTPIALGTGAEE64 pKa = 4.27DD65 pKa = 3.18RR66 pKa = 11.84TGPVLTVSSMYY77 pKa = 10.79LKK79 pKa = 10.86GVVLPSDD86 pKa = 3.44NVTDD90 pKa = 4.3GLHH93 pKa = 7.49DD94 pKa = 3.64IYY96 pKa = 11.1FWIILDD102 pKa = 4.21RR103 pKa = 11.84FPTGTDD109 pKa = 3.31PSVSDD114 pKa = 3.88IFTGSDD120 pKa = 2.91NSGSMIEE127 pKa = 4.08TLTRR131 pKa = 11.84NRR133 pKa = 11.84LNRR136 pKa = 11.84KK137 pKa = 8.14RR138 pKa = 11.84FRR140 pKa = 11.84ILGSKK145 pKa = 9.98KK146 pKa = 10.47LVVGVNKK153 pKa = 10.1KK154 pKa = 8.96PQEE157 pKa = 4.26SLPHH161 pKa = 5.69SRR163 pKa = 11.84AAFNIFQRR171 pKa = 11.84RR172 pKa = 11.84RR173 pKa = 11.84LVVAFKK179 pKa = 11.03NDD181 pKa = 3.04VSGGGRR187 pKa = 11.84NDD189 pKa = 3.11VEE191 pKa = 4.33RR192 pKa = 11.84NRR194 pKa = 11.84IYY196 pKa = 11.03LSAASASGHH205 pKa = 4.99TFRR208 pKa = 11.84LYY210 pKa = 11.35LNGIVNFYY218 pKa = 10.81NGVIFQQ224 pKa = 3.96
Molecular weight: 25.28 kDa
Isoelectric point according different methods:
Peptides (in silico digests for buttom-up proteomics)
Below you can find in silico digests of the whole proteome with Trypsin, Chymotrypsin, Trypsin+LysC, LysN, ArgC proteases suitable for different mass spec machines.| Try ESI |
 |
|---|
| ChTry ESI |
 |
|---|
| ArgC ESI |
 |
|---|
| LysN ESI |
 |
|---|
| TryLysC ESI |
 |
|---|
| Try MALDI |
 |
|---|
| ChTry MALDI |
 |
|---|
| ArgC MALDI |
 |
|---|
| LysN MALDI |
 |
|---|
| TryLysC MALDI |
 |
|---|
| Try LTQ |
 |
|---|
| ChTry LTQ |
 |
|---|
| ArgC LTQ |
 |
|---|
| LysN LTQ |
 |
|---|
| TryLysC LTQ |
 |
|---|
| Try MSlow |
 |
|---|
| ChTry MSlow |
 |
|---|
| ArgC MSlow |
 |
|---|
| LysN MSlow |
 |
|---|
| TryLysC MSlow |
 |
|---|
| Try MShigh |
 |
|---|
| ChTry MShigh |
 |
|---|
| ArgC MShigh |
 |
|---|
| LysN MShigh |
 |
|---|
| TryLysC MShigh |
 |
|---|
General Statistics
Number of major isoforms |
Number of additional isoforms |
Number of all proteins |
Number of amino acids |
Min. Seq. Length |
Max. Seq. Length |
Avg. Seq. Length |
Avg. Mol. Weight |
|---|---|---|---|---|---|---|---|
0 |
1086 |
123 |
264 |
181.0 |
20.76 |
Amino acid frequency
Ala |
Cys |
Asp |
Glu |
Phe |
Gly |
His |
Ile |
Lys |
Leu |
|---|---|---|---|---|---|---|---|---|---|
4.512 ± 0.658 | 2.026 ± 0.905 |
6.077 ± 1.19 | 6.169 ± 1.441 |
4.236 ± 0.752 | 5.157 ± 0.998 |
2.486 ± 0.551 | 5.617 ± 1.055 |
6.446 ± 0.723 | 9.576 ± 0.869 |
Met |
Asn |
Gln |
Pro |
Arg |
Ser |
Thr |
Val |
Trp |
Tyr |
|---|---|---|---|---|---|---|---|---|---|
1.381 ± 0.314 | 5.433 ± 1.098 |
5.433 ± 0.748 | 3.867 ± 0.785 |
6.998 ± 1.911 | 8.471 ± 1.381 |
6.077 ± 0.83 | 4.788 ± 1.004 |
1.381 ± 0.288 | 3.867 ± 0.711 |
Most of the basic statistics you can see at this page can be downloaded from this CSV file
Proteome-pI is available under Creative Commons Attribution-NoDerivs license, for more details see here
| Reference: Kozlowski LP. Proteome-pI 2.0: Proteome Isoelectric Point Database Update. Nucleic Acids Res. 2021, doi: 10.1093/nar/gkab944 | Contact: Lukasz P. Kozlowski |
