Ligilactobacillus acidipiscis
Taxonomy: cellular organisms; Bacteria; Terrabacteria group; Firmicutes; Bacilli; Lactobacillales; Lactobacillaceae; Ligilactobacillus
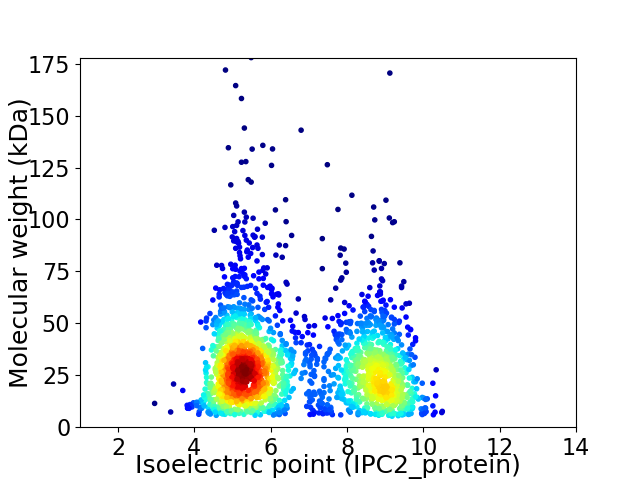
Average proteome isoelectric point is 6.69
Get precalculated fractions of proteins

Virtual 2D-PAGE plot for 2127 proteins (isoelectric point calculated using IPC2_protein)
Get csv file with sequences according to given criteria:
* You can choose from 21 different methods for calculating isoelectric point
Summary statistics related to proteome-wise predictions


Protein with the lowest isoelectric point:
>tr|A0A0R2KKY0|A0A0R2KKY0_9LACO Phage protein OS=Ligilactobacillus acidipiscis OX=89059 GN=IV43_GL000048 PE=4 SV=1
MM1 pKa = 7.7DD2 pKa = 4.56NEE4 pKa = 4.01MTFYY8 pKa = 10.64QFLMTLRR15 pKa = 11.84DD16 pKa = 3.53PDD18 pKa = 4.86DD19 pKa = 4.47YY20 pKa = 12.08DD21 pKa = 4.13EE22 pKa = 4.85VVQFANNAFYY32 pKa = 10.75DD33 pKa = 3.55QSFPKK38 pKa = 10.33QQTNYY43 pKa = 9.96QKK45 pKa = 10.8LSQYY49 pKa = 11.5LEE51 pKa = 4.04MNGNYY56 pKa = 9.42LPSMTIFDD64 pKa = 5.07DD65 pKa = 3.65AWQQYY70 pKa = 8.45LEE72 pKa = 4.74KK73 pKa = 10.46IQQ75 pKa = 3.45
MM1 pKa = 7.7DD2 pKa = 4.56NEE4 pKa = 4.01MTFYY8 pKa = 10.64QFLMTLRR15 pKa = 11.84DD16 pKa = 3.53PDD18 pKa = 4.86DD19 pKa = 4.47YY20 pKa = 12.08DD21 pKa = 4.13EE22 pKa = 4.85VVQFANNAFYY32 pKa = 10.75DD33 pKa = 3.55QSFPKK38 pKa = 10.33QQTNYY43 pKa = 9.96QKK45 pKa = 10.8LSQYY49 pKa = 11.5LEE51 pKa = 4.04MNGNYY56 pKa = 9.42LPSMTIFDD64 pKa = 5.07DD65 pKa = 3.65AWQQYY70 pKa = 8.45LEE72 pKa = 4.74KK73 pKa = 10.46IQQ75 pKa = 3.45
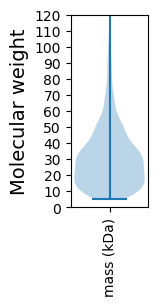
Molecular weight: 9.16 kDa
Isoelectric point according different methods:
Protein with the highest isoelectric point:
>tr|A0A0R2KAZ3|A0A0R2KAZ3_9LACO NLPA lipoprotein OS=Ligilactobacillus acidipiscis OX=89059 GN=IV43_GL001231 PE=3 SV=1
MM1 pKa = 7.09EE2 pKa = 5.33RR3 pKa = 11.84CRR5 pKa = 11.84FCKK8 pKa = 8.82STKK11 pKa = 8.56VVKK14 pKa = 10.28NGKK17 pKa = 9.56RR18 pKa = 11.84PTKK21 pKa = 10.46LKK23 pKa = 10.76LPSLSEE29 pKa = 3.67QPLRR33 pKa = 11.84FRR35 pKa = 11.84LYY37 pKa = 9.13KK38 pKa = 9.78QRR40 pKa = 11.84YY41 pKa = 5.88FCRR44 pKa = 11.84EE45 pKa = 3.63CHH47 pKa = 5.28RR48 pKa = 11.84TFSAKK53 pKa = 9.52TEE55 pKa = 3.74LTQRR59 pKa = 11.84HH60 pKa = 4.93RR61 pKa = 11.84SITRR65 pKa = 11.84RR66 pKa = 11.84ARR68 pKa = 11.84QVIHH72 pKa = 6.64SLAKK76 pKa = 8.68EE77 pKa = 3.88TSPVKK82 pKa = 10.75NIAKK86 pKa = 9.71IVGVSASSVQRR97 pKa = 11.84ILYY100 pKa = 9.82ANKK103 pKa = 8.27TANVTPHH110 pKa = 7.13GLPKK114 pKa = 10.27ALCFAEE120 pKa = 4.35FRR122 pKa = 11.84STRR125 pKa = 11.84GRR127 pKa = 11.84FSFICIDD134 pKa = 4.43AKK136 pKa = 10.3THH138 pKa = 6.11DD139 pKa = 4.05CSYY142 pKa = 11.72SKK144 pKa = 10.26IACLRR149 pKa = 11.84RR150 pKa = 11.84SKK152 pKa = 10.99NIFSIITFF160 pKa = 4.1
MM1 pKa = 7.09EE2 pKa = 5.33RR3 pKa = 11.84CRR5 pKa = 11.84FCKK8 pKa = 8.82STKK11 pKa = 8.56VVKK14 pKa = 10.28NGKK17 pKa = 9.56RR18 pKa = 11.84PTKK21 pKa = 10.46LKK23 pKa = 10.76LPSLSEE29 pKa = 3.67QPLRR33 pKa = 11.84FRR35 pKa = 11.84LYY37 pKa = 9.13KK38 pKa = 9.78QRR40 pKa = 11.84YY41 pKa = 5.88FCRR44 pKa = 11.84EE45 pKa = 3.63CHH47 pKa = 5.28RR48 pKa = 11.84TFSAKK53 pKa = 9.52TEE55 pKa = 3.74LTQRR59 pKa = 11.84HH60 pKa = 4.93RR61 pKa = 11.84SITRR65 pKa = 11.84RR66 pKa = 11.84ARR68 pKa = 11.84QVIHH72 pKa = 6.64SLAKK76 pKa = 8.68EE77 pKa = 3.88TSPVKK82 pKa = 10.75NIAKK86 pKa = 9.71IVGVSASSVQRR97 pKa = 11.84ILYY100 pKa = 9.82ANKK103 pKa = 8.27TANVTPHH110 pKa = 7.13GLPKK114 pKa = 10.27ALCFAEE120 pKa = 4.35FRR122 pKa = 11.84STRR125 pKa = 11.84GRR127 pKa = 11.84FSFICIDD134 pKa = 4.43AKK136 pKa = 10.3THH138 pKa = 6.11DD139 pKa = 4.05CSYY142 pKa = 11.72SKK144 pKa = 10.26IACLRR149 pKa = 11.84RR150 pKa = 11.84SKK152 pKa = 10.99NIFSIITFF160 pKa = 4.1
Molecular weight: 18.5 kDa
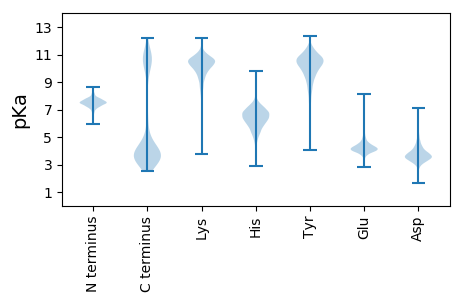
Isoelectric point according different methods:
Peptides (in silico digests for buttom-up proteomics)
Below you can find in silico digests of the whole proteome with Trypsin, Chymotrypsin, Trypsin+LysC, LysN, ArgC proteases suitable for different mass spec machines.| Try ESI |
 |
|---|
| ChTry ESI |
 |
|---|
| ArgC ESI |
 |
|---|
| LysN ESI |
 |
|---|
| TryLysC ESI |
 |
|---|
| Try MALDI |
 |
|---|
| ChTry MALDI |
 |
|---|
| ArgC MALDI |
 |
|---|
| LysN MALDI |
 |
|---|
| TryLysC MALDI |
 |
|---|
| Try LTQ |
 |
|---|
| ChTry LTQ |
 |
|---|
| ArgC LTQ |
 |
|---|
| LysN LTQ |
 |
|---|
| TryLysC LTQ |
 |
|---|
| Try MSlow |
 |
|---|
| ChTry MSlow |
 |
|---|
| ArgC MSlow |
 |
|---|
| LysN MSlow |
 |
|---|
| TryLysC MSlow |
 |
|---|
| Try MShigh |
 |
|---|
| ChTry MShigh |
 |
|---|
| ArgC MShigh |
 |
|---|
| LysN MShigh |
 |
|---|
| TryLysC MShigh |
 |
|---|
General Statistics
Number of major isoforms |
Number of additional isoforms |
Number of all proteins |
Number of amino acids |
Min. Seq. Length |
Max. Seq. Length |
Avg. Seq. Length |
Avg. Mol. Weight |
|---|---|---|---|---|---|---|---|
0 |
615153 |
50 |
1601 |
289.2 |
32.34 |
Amino acid frequency
Ala |
Cys |
Asp |
Glu |
Phe |
Gly |
His |
Ile |
Lys |
Leu |
|---|---|---|---|---|---|---|---|---|---|
7.527 ± 0.064 | 0.58 ± 0.015 |
5.835 ± 0.049 | 5.996 ± 0.057 |
4.364 ± 0.045 | 6.628 ± 0.052 |
2.042 ± 0.021 | 6.883 ± 0.054 |
7.27 ± 0.064 | 9.807 ± 0.06 |
Met |
Asn |
Gln |
Pro |
Arg |
Ser |
Thr |
Val |
Trp |
Tyr |
|---|---|---|---|---|---|---|---|---|---|
2.61 ± 0.027 | 4.882 ± 0.037 |
3.477 ± 0.025 | 4.783 ± 0.052 |
3.916 ± 0.039 | 6.168 ± 0.043 |
5.651 ± 0.037 | 6.967 ± 0.043 |
0.945 ± 0.018 | 3.536 ± 0.038 |
Most of the basic statistics you can see at this page can be downloaded from this CSV file
Proteome-pI is available under Creative Commons Attribution-NoDerivs license, for more details see here
| Reference: Kozlowski LP. Proteome-pI 2.0: Proteome Isoelectric Point Database Update. Nucleic Acids Res. 2021, doi: 10.1093/nar/gkab944 | Contact: Lukasz P. Kozlowski |
