Candidatus Nitrotoga sp. AM1P
Taxonomy: cellular organisms; Bacteria; Proteobacteria; Betaproteobacteria; Nitrosomonadales; Gallionellaceae; Candidatus Nitrotoga; unclassified Candidatus Nitrotoga
Average proteome isoelectric point is 6.78
Get precalculated fractions of proteins
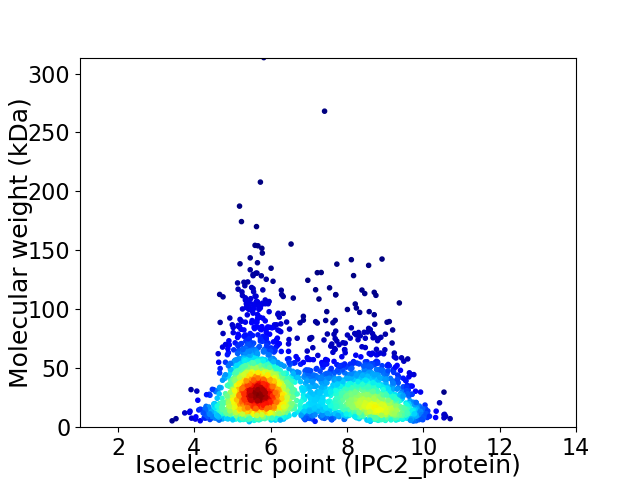
Virtual 2D-PAGE plot for 2658 proteins (isoelectric point calculated using IPC2_protein)
Get csv file with sequences according to given criteria:
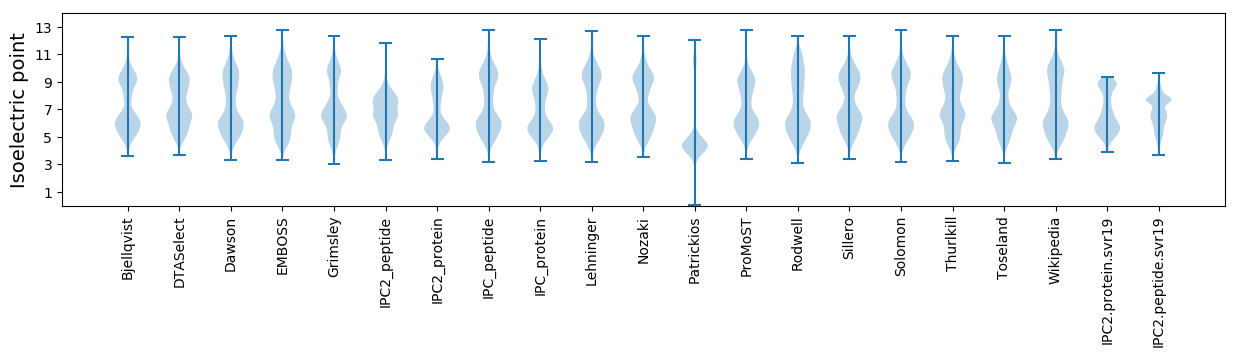
* You can choose from 21 different methods for calculating isoelectric point
Summary statistics related to proteome-wise predictions
Protein with the lowest isoelectric point:
>tr|A0A455X4R2|A0A455X4R2_9PROT 4Fe-4S ferredoxin OS=Candidatus Nitrotoga sp. AM1P OX=2559597 GN=W01_23910 PE=4 SV=1
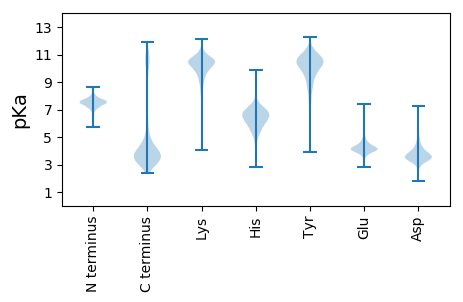
MM1 pKa = 7.38TPNPEE6 pKa = 4.11YY7 pKa = 9.42KK8 pKa = 9.97TYY10 pKa = 9.92MCLICGWLYY19 pKa = 11.27DD20 pKa = 4.08EE21 pKa = 5.13ATGSPEE27 pKa = 5.07DD28 pKa = 4.75GILPGTRR35 pKa = 11.84WEE37 pKa = 4.26DD38 pKa = 3.46VPVNWTCPEE47 pKa = 3.86CGARR51 pKa = 11.84KK52 pKa = 9.56EE53 pKa = 4.09DD54 pKa = 3.55FDD56 pKa = 3.85MVEE59 pKa = 4.07FF60 pKa = 4.63
MM1 pKa = 7.38TPNPEE6 pKa = 4.11YY7 pKa = 9.42KK8 pKa = 9.97TYY10 pKa = 9.92MCLICGWLYY19 pKa = 11.27DD20 pKa = 4.08EE21 pKa = 5.13ATGSPEE27 pKa = 5.07DD28 pKa = 4.75GILPGTRR35 pKa = 11.84WEE37 pKa = 4.26DD38 pKa = 3.46VPVNWTCPEE47 pKa = 3.86CGARR51 pKa = 11.84KK52 pKa = 9.56EE53 pKa = 4.09DD54 pKa = 3.55FDD56 pKa = 3.85MVEE59 pKa = 4.07FF60 pKa = 4.63
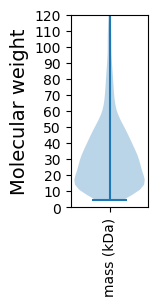
Molecular weight: 6.91 kDa
Isoelectric point according different methods:
Protein with the highest isoelectric point:
>tr|A0A455WZD2|A0A455WZD2_9PROT NTP_transf_2 domain-containing protein OS=Candidatus Nitrotoga sp. AM1P OX=2559597 GN=W01_03140 PE=4 SV=1
MM1 pKa = 6.98KK2 pKa = 10.26HH3 pKa = 6.63EE4 pKa = 4.25YY5 pKa = 8.93PQPFARR11 pKa = 11.84NYY13 pKa = 9.65EE14 pKa = 4.24SLLKK18 pKa = 10.23RR19 pKa = 11.84LKK21 pKa = 10.65LRR23 pKa = 11.84GMQPLYY29 pKa = 10.91GLKK32 pKa = 10.01FYY34 pKa = 10.28YY35 pKa = 10.56AHH37 pKa = 6.96VLDD40 pKa = 4.45QPWPGAEE47 pKa = 3.88LTKK50 pKa = 10.59APKK53 pKa = 10.09VSRR56 pKa = 11.84LPDD59 pKa = 3.29IVTVAQMQQIINATRR74 pKa = 11.84VLSYY78 pKa = 10.78RR79 pKa = 11.84VFFFTLYY86 pKa = 11.32SMGLRR91 pKa = 11.84LGEE94 pKa = 4.08GLQLRR99 pKa = 11.84VGDD102 pKa = 5.21LDD104 pKa = 3.69AQQMRR109 pKa = 11.84VHH111 pKa = 6.16VRR113 pKa = 11.84DD114 pKa = 3.35AKK116 pKa = 10.58GNRR119 pKa = 11.84DD120 pKa = 3.51RR121 pKa = 11.84LVPLPTHH128 pKa = 4.96TLEE131 pKa = 4.18VLRR134 pKa = 11.84AFWKK138 pKa = 8.75NTATRR143 pKa = 11.84CCCFPAAKK151 pKa = 9.74KK152 pKa = 10.47ASQTQPAPRR161 pKa = 11.84RR162 pKa = 11.84TWIVVGCNKK171 pKa = 9.69RR172 pKa = 11.84CAKK175 pKa = 9.26SRR177 pKa = 11.84RR178 pKa = 11.84RR179 pKa = 11.84SVV181 pKa = 2.72
MM1 pKa = 6.98KK2 pKa = 10.26HH3 pKa = 6.63EE4 pKa = 4.25YY5 pKa = 8.93PQPFARR11 pKa = 11.84NYY13 pKa = 9.65EE14 pKa = 4.24SLLKK18 pKa = 10.23RR19 pKa = 11.84LKK21 pKa = 10.65LRR23 pKa = 11.84GMQPLYY29 pKa = 10.91GLKK32 pKa = 10.01FYY34 pKa = 10.28YY35 pKa = 10.56AHH37 pKa = 6.96VLDD40 pKa = 4.45QPWPGAEE47 pKa = 3.88LTKK50 pKa = 10.59APKK53 pKa = 10.09VSRR56 pKa = 11.84LPDD59 pKa = 3.29IVTVAQMQQIINATRR74 pKa = 11.84VLSYY78 pKa = 10.78RR79 pKa = 11.84VFFFTLYY86 pKa = 11.32SMGLRR91 pKa = 11.84LGEE94 pKa = 4.08GLQLRR99 pKa = 11.84VGDD102 pKa = 5.21LDD104 pKa = 3.69AQQMRR109 pKa = 11.84VHH111 pKa = 6.16VRR113 pKa = 11.84DD114 pKa = 3.35AKK116 pKa = 10.58GNRR119 pKa = 11.84DD120 pKa = 3.51RR121 pKa = 11.84LVPLPTHH128 pKa = 4.96TLEE131 pKa = 4.18VLRR134 pKa = 11.84AFWKK138 pKa = 8.75NTATRR143 pKa = 11.84CCCFPAAKK151 pKa = 9.74KK152 pKa = 10.47ASQTQPAPRR161 pKa = 11.84RR162 pKa = 11.84TWIVVGCNKK171 pKa = 9.69RR172 pKa = 11.84CAKK175 pKa = 9.26SRR177 pKa = 11.84RR178 pKa = 11.84RR179 pKa = 11.84SVV181 pKa = 2.72
Molecular weight: 20.92 kDa
Isoelectric point according different methods:
Peptides (in silico digests for buttom-up proteomics)
Below you can find in silico digests of the whole proteome with Trypsin, Chymotrypsin, Trypsin+LysC, LysN, ArgC proteases suitable for different mass spec machines.| Try ESI |
 |
|---|
| ChTry ESI |
|
|---|
| ArgC ESI |
|
|---|
| LysN ESI |
|
|---|
| TryLysC ESI |
|
|---|
| Try MALDI |
|
|---|
| ChTry MALDI |
|
|---|
| ArgC MALDI |
|
|---|
| LysN MALDI |
|
|---|
| TryLysC MALDI |
|
|---|
| Try LTQ |
|
|---|
| ChTry LTQ |
|
|---|
| ArgC LTQ |
|
|---|
| LysN LTQ |
|
|---|
| TryLysC LTQ |
|
|---|
| Try MSlow |
|
|---|
| ChTry MSlow |
|
|---|
| ArgC MSlow |
|
|---|
| LysN MSlow |
|
|---|
| TryLysC MSlow |
|
|---|
| Try MShigh |
|
|---|
| ChTry MShigh |
|
|---|
| ArgC MShigh |
|
|---|
| LysN MShigh |
|
|---|
| TryLysC MShigh |
|
|---|
General Statistics
Number of major isoforms |
Number of additional isoforms |
Number of all proteins |
Number of amino acids |
Min. Seq. Length |
Max. Seq. Length |
Avg. Seq. Length |
Avg. Mol. Weight |
|---|---|---|---|---|---|---|---|
0 |
833905 |
42 |
2812 |
313.7 |
34.74 |
Amino acid frequency
Ala |
Cys |
Asp |
Glu |
Phe |
Gly |
His |
Ile |
Lys |
Leu |
|---|---|---|---|---|---|---|---|---|---|
9.728 ± 0.05 | 0.98 ± 0.018 |
5.125 ± 0.031 | 5.745 ± 0.046 |
3.821 ± 0.031 | 7.181 ± 0.043 |
2.447 ± 0.026 | 6.074 ± 0.04 |
4.76 ± 0.04 | 10.679 ± 0.058 |
Met |
Asn |
Gln |
Pro |
Arg |
Ser |
Thr |
Val |
Trp |
Tyr |
|---|---|---|---|---|---|---|---|---|---|
2.603 ± 0.022 | 3.998 ± 0.031 |
4.409 ± 0.031 | 4.304 ± 0.042 |
5.708 ± 0.048 | 5.893 ± 0.037 |
5.401 ± 0.051 | 7.009 ± 0.04 |
1.324 ± 0.023 | 2.812 ± 0.026 |
Most of the basic statistics you can see at this page can be downloaded from this CSV file
See this proteome in:

Proteome-pI is available under Creative Commons Attribution-NoDerivs license, for more details see here
| Reference: Kozlowski LP. Proteome-pI 2.0: Proteome Isoelectric Point Database Update. Nucleic Acids Res. 2021, doi: 10.1093/nar/gkab944 | Contact: Lukasz P. Kozlowski |