Corynebacterium resistens (strain DSM 45100 / JCM 12819 / GTC 2026 / SICGH 158)
Taxonomy: cellular organisms; Bacteria; Terrabacteria group; Actinobacteria; Actinomycetia; Corynebacteriales; Corynebacteriaceae; Corynebacterium; Corynebacterium resistens
Average proteome isoelectric point is 6.27
Get precalculated fractions of proteins

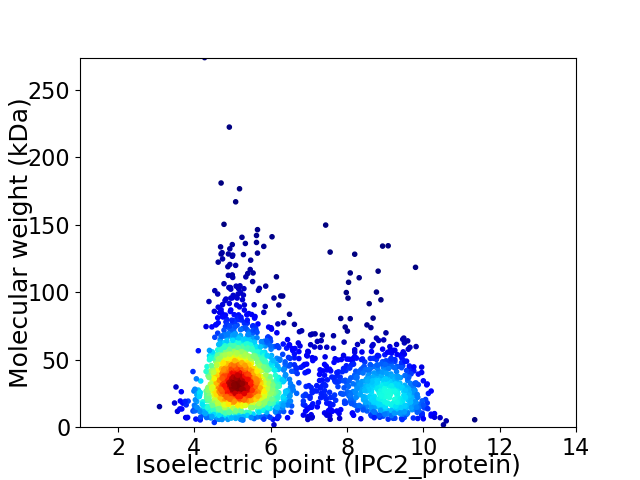
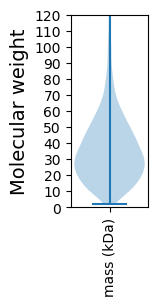
Virtual 2D-PAGE plot for 2160 proteins (isoelectric point calculated using IPC2_protein)
Get csv file with sequences according to given criteria:
* You can choose from 21 different methods for calculating isoelectric point
Summary statistics related to proteome-wise predictions


Protein with the lowest isoelectric point:
>tr|F8DY62|F8DY62_CORRG Putative membrane protein OS=Corynebacterium resistens (strain DSM 45100 / JCM 12819 / GTC 2026 / SICGH 158) OX=662755 GN=CRES_0441 PE=4 SV=1
MM1 pKa = 7.42NPTRR5 pKa = 11.84GEE7 pKa = 4.08TDD9 pKa = 3.36PSRR12 pKa = 11.84NPVPSEE18 pKa = 3.53HH19 pKa = 6.87HH20 pKa = 6.61GGDD23 pKa = 3.44GAATGGHH30 pKa = 7.22DD31 pKa = 4.32SPVLTPVEE39 pKa = 3.96ALVEE43 pKa = 4.26QFGPPSVSLEE53 pKa = 4.14DD54 pKa = 3.72MLQVALDD61 pKa = 4.25PSTPDD66 pKa = 3.97PGDD69 pKa = 3.39EE70 pKa = 5.31LIPDD74 pKa = 3.99NDD76 pKa = 4.14SVHH79 pKa = 7.38DD80 pKa = 4.08SASDD84 pKa = 3.23AGADD88 pKa = 3.23AGGASGEE95 pKa = 4.42PDD97 pKa = 4.25LSDD100 pKa = 5.11LGDD103 pKa = 3.63GSYY106 pKa = 11.24PDD108 pKa = 4.22ATPGAADD115 pKa = 5.05DD116 pKa = 4.75LPSPTGEE123 pKa = 4.04SEE125 pKa = 4.43AVGGEE130 pKa = 3.95HH131 pKa = 7.66WDD133 pKa = 3.77TNQPNPQGHH142 pKa = 7.49DD143 pKa = 3.52DD144 pKa = 3.89YY145 pKa = 11.71GVPGEE150 pKa = 3.88DD151 pKa = 3.64HH152 pKa = 7.22GYY154 pKa = 9.7GGYY157 pKa = 10.69DD158 pKa = 3.3GVHH161 pKa = 7.03DD162 pKa = 5.03PNHH165 pKa = 5.83GTGGHH170 pKa = 4.86NTHH173 pKa = 7.19PNAHH177 pKa = 6.01EE178 pKa = 3.9TDD180 pKa = 3.49PFNDD184 pKa = 3.36EE185 pKa = 4.18GGIGG189 pKa = 3.32
MM1 pKa = 7.42NPTRR5 pKa = 11.84GEE7 pKa = 4.08TDD9 pKa = 3.36PSRR12 pKa = 11.84NPVPSEE18 pKa = 3.53HH19 pKa = 6.87HH20 pKa = 6.61GGDD23 pKa = 3.44GAATGGHH30 pKa = 7.22DD31 pKa = 4.32SPVLTPVEE39 pKa = 3.96ALVEE43 pKa = 4.26QFGPPSVSLEE53 pKa = 4.14DD54 pKa = 3.72MLQVALDD61 pKa = 4.25PSTPDD66 pKa = 3.97PGDD69 pKa = 3.39EE70 pKa = 5.31LIPDD74 pKa = 3.99NDD76 pKa = 4.14SVHH79 pKa = 7.38DD80 pKa = 4.08SASDD84 pKa = 3.23AGADD88 pKa = 3.23AGGASGEE95 pKa = 4.42PDD97 pKa = 4.25LSDD100 pKa = 5.11LGDD103 pKa = 3.63GSYY106 pKa = 11.24PDD108 pKa = 4.22ATPGAADD115 pKa = 5.05DD116 pKa = 4.75LPSPTGEE123 pKa = 4.04SEE125 pKa = 4.43AVGGEE130 pKa = 3.95HH131 pKa = 7.66WDD133 pKa = 3.77TNQPNPQGHH142 pKa = 7.49DD143 pKa = 3.52DD144 pKa = 3.89YY145 pKa = 11.71GVPGEE150 pKa = 3.88DD151 pKa = 3.64HH152 pKa = 7.22GYY154 pKa = 9.7GGYY157 pKa = 10.69DD158 pKa = 3.3GVHH161 pKa = 7.03DD162 pKa = 5.03PNHH165 pKa = 5.83GTGGHH170 pKa = 4.86NTHH173 pKa = 7.19PNAHH177 pKa = 6.01EE178 pKa = 3.9TDD180 pKa = 3.49PFNDD184 pKa = 3.36EE185 pKa = 4.18GGIGG189 pKa = 3.32
Molecular weight: 19.15 kDa
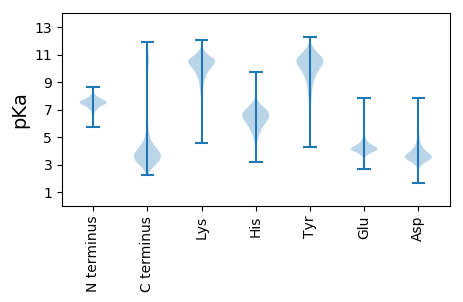
Isoelectric point according different methods:
Protein with the highest isoelectric point:
>tr|F8DXH4|F8DXH4_CORRG Putative oxidoreductase OS=Corynebacterium resistens (strain DSM 45100 / JCM 12819 / GTC 2026 / SICGH 158) OX=662755 GN=CRES_0356 PE=4 SV=1
MM1 pKa = 7.69AKK3 pKa = 10.06GKK5 pKa = 8.69RR6 pKa = 11.84TFQPNNRR13 pKa = 11.84RR14 pKa = 11.84RR15 pKa = 11.84ARR17 pKa = 11.84VHH19 pKa = 5.99GFRR22 pKa = 11.84TRR24 pKa = 11.84MRR26 pKa = 11.84TRR28 pKa = 11.84AGRR31 pKa = 11.84AIVSARR37 pKa = 11.84RR38 pKa = 11.84RR39 pKa = 11.84KK40 pKa = 9.22GRR42 pKa = 11.84KK43 pKa = 9.07SLTAA47 pKa = 4.07
MM1 pKa = 7.69AKK3 pKa = 10.06GKK5 pKa = 8.69RR6 pKa = 11.84TFQPNNRR13 pKa = 11.84RR14 pKa = 11.84RR15 pKa = 11.84ARR17 pKa = 11.84VHH19 pKa = 5.99GFRR22 pKa = 11.84TRR24 pKa = 11.84MRR26 pKa = 11.84TRR28 pKa = 11.84AGRR31 pKa = 11.84AIVSARR37 pKa = 11.84RR38 pKa = 11.84RR39 pKa = 11.84KK40 pKa = 9.22GRR42 pKa = 11.84KK43 pKa = 9.07SLTAA47 pKa = 4.07
Molecular weight: 5.52 kDa
Isoelectric point according different methods:
Peptides (in silico digests for buttom-up proteomics)
Below you can find in silico digests of the whole proteome with Trypsin, Chymotrypsin, Trypsin+LysC, LysN, ArgC proteases suitable for different mass spec machines.| Try ESI |
 |
|---|
| ChTry ESI |
 |
|---|
| ArgC ESI |
 |
|---|
| LysN ESI |
 |
|---|
| TryLysC ESI |
 |
|---|
| Try MALDI |
 |
|---|
| ChTry MALDI |
 |
|---|
| ArgC MALDI |
 |
|---|
| LysN MALDI |
 |
|---|
| TryLysC MALDI |
 |
|---|
| Try LTQ |
 |
|---|
| ChTry LTQ |
 |
|---|
| ArgC LTQ |
 |
|---|
| LysN LTQ |
 |
|---|
| TryLysC LTQ |
 |
|---|
| Try MSlow |
 |
|---|
| ChTry MSlow |
 |
|---|
| ArgC MSlow |
 |
|---|
| LysN MSlow |
 |
|---|
| TryLysC MSlow |
 |
|---|
| Try MShigh |
 |
|---|
| ChTry MShigh |
 |
|---|
| ArgC MShigh |
 |
|---|
| LysN MShigh |
 |
|---|
| TryLysC MShigh |
 |
|---|
General Statistics
Number of major isoforms |
Number of additional isoforms |
Number of all proteins |
Number of amino acids |
Min. Seq. Length |
Max. Seq. Length |
Avg. Seq. Length |
Avg. Mol. Weight |
|---|---|---|---|---|---|---|---|
0 |
755222 |
14 |
2667 |
349.6 |
37.93 |
Amino acid frequency
Ala |
Cys |
Asp |
Glu |
Phe |
Gly |
His |
Ile |
Lys |
Leu |
|---|---|---|---|---|---|---|---|---|---|
11.308 ± 0.058 | 0.732 ± 0.014 |
5.816 ± 0.043 | 6.361 ± 0.064 |
3.215 ± 0.034 | 8.451 ± 0.043 |
2.186 ± 0.024 | 4.867 ± 0.038 |
3.869 ± 0.043 | 9.163 ± 0.063 |
Met |
Asn |
Gln |
Pro |
Arg |
Ser |
Thr |
Val |
Trp |
Tyr |
|---|---|---|---|---|---|---|---|---|---|
2.275 ± 0.023 | 3.186 ± 0.031 |
5.099 ± 0.045 | 3.542 ± 0.03 |
6.331 ± 0.053 | 6.069 ± 0.041 |
6.031 ± 0.047 | 7.989 ± 0.048 |
1.372 ± 0.021 | 2.14 ± 0.025 |
Most of the basic statistics you can see at this page can be downloaded from this CSV file
Proteome-pI is available under Creative Commons Attribution-NoDerivs license, for more details see here
| Reference: Kozlowski LP. Proteome-pI 2.0: Proteome Isoelectric Point Database Update. Nucleic Acids Res. 2021, doi: 10.1093/nar/gkab944 | Contact: Lukasz P. Kozlowski |
