Agaricus bisporus var. burnettii (strain JB137-S8 / ATCC MYA-4627 / FGSC 10392) (White button mushroom)
Taxonomy: cellular organisms; Eukaryota; Opisthokonta; Fungi; Dikarya; Basidiomycota; Agaricomycotina; Agaricomycetes; Agaricomycetidae; Agaricales; Agaricaceae; Agaricus; Agaricus bisporus; Agaricus bisporus var. burnettii
Average proteome isoelectric point is 6.69
Get precalculated fractions of proteins

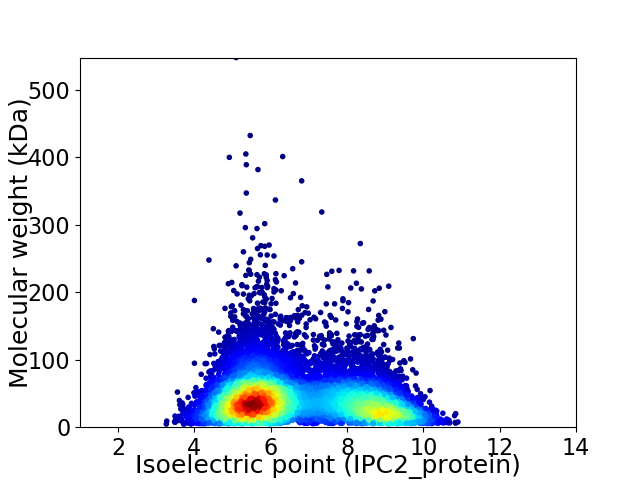
Virtual 2D-PAGE plot for 11211 proteins (isoelectric point calculated using IPC2_protein)
Get csv file with sequences according to given criteria:
* You can choose from 21 different methods for calculating isoelectric point
Summary statistics related to proteome-wise predictions


Protein with the lowest isoelectric point:
>tr|K5VTA9|K5VTA9_AGABU Uncharacterized protein OS=Agaricus bisporus var. burnettii (strain JB137-S8 / ATCC MYA-4627 / FGSC 10392) OX=597362 GN=AGABI1DRAFT_93062 PE=4 SV=1
MM1 pKa = 7.18VKK3 pKa = 8.68ITALFVLSALSCLVSAAPVLEE24 pKa = 3.92KK25 pKa = 10.59RR26 pKa = 11.84IAQVTSDD33 pKa = 4.87SKK35 pKa = 11.43AAWEE39 pKa = 4.21QACVAAGGGAQCNKK53 pKa = 9.92IGINAASTLLAAADD67 pKa = 3.54ACAQQDD73 pKa = 3.77AADD76 pKa = 4.65DD77 pKa = 4.47MIDD80 pKa = 4.64LAKK83 pKa = 10.78QLDD86 pKa = 4.24NDD88 pKa = 4.01PEE90 pKa = 4.4MIRR93 pKa = 11.84LAQLFVQQPRR103 pKa = 11.84NAPDD107 pKa = 3.46SLQVPYY113 pKa = 10.37CQQAPKK119 pKa = 10.39NAEE122 pKa = 3.8LDD124 pKa = 4.01GLFHH128 pKa = 6.75CQFEE132 pKa = 4.78GSKK135 pKa = 10.95FPDD138 pKa = 3.93FSGDD142 pKa = 3.21QTGNVPLGLNQVNPPGSCPANPTGPIPDD170 pKa = 3.69GVQLNTLVDD179 pKa = 4.27DD180 pKa = 5.16PGLEE184 pKa = 4.06NAAGGASSGGASSGGAAPSDD204 pKa = 3.52NSSADD209 pKa = 3.75DD210 pKa = 3.95EE211 pKa = 4.84ASSDD215 pKa = 3.64INNGANGGAAGGAEE229 pKa = 4.64DD230 pKa = 4.49NDD232 pKa = 3.94ASGGAIGNNSDD243 pKa = 3.58TGATGAGGDD252 pKa = 3.57FVLQNGQDD260 pKa = 3.49AQSQNSQFADD270 pKa = 3.27ITADD274 pKa = 3.66SPCTDD279 pKa = 3.82GEE281 pKa = 4.37NACVGSDD288 pKa = 3.52FAQCVGGKK296 pKa = 9.48FVTTSCGGNLICAALPLVNAPGTSVTCTTAADD328 pKa = 3.78RR329 pKa = 11.84DD330 pKa = 3.74ARR332 pKa = 11.84IAATGAA338 pKa = 3.25
MM1 pKa = 7.18VKK3 pKa = 8.68ITALFVLSALSCLVSAAPVLEE24 pKa = 3.92KK25 pKa = 10.59RR26 pKa = 11.84IAQVTSDD33 pKa = 4.87SKK35 pKa = 11.43AAWEE39 pKa = 4.21QACVAAGGGAQCNKK53 pKa = 9.92IGINAASTLLAAADD67 pKa = 3.54ACAQQDD73 pKa = 3.77AADD76 pKa = 4.65DD77 pKa = 4.47MIDD80 pKa = 4.64LAKK83 pKa = 10.78QLDD86 pKa = 4.24NDD88 pKa = 4.01PEE90 pKa = 4.4MIRR93 pKa = 11.84LAQLFVQQPRR103 pKa = 11.84NAPDD107 pKa = 3.46SLQVPYY113 pKa = 10.37CQQAPKK119 pKa = 10.39NAEE122 pKa = 3.8LDD124 pKa = 4.01GLFHH128 pKa = 6.75CQFEE132 pKa = 4.78GSKK135 pKa = 10.95FPDD138 pKa = 3.93FSGDD142 pKa = 3.21QTGNVPLGLNQVNPPGSCPANPTGPIPDD170 pKa = 3.69GVQLNTLVDD179 pKa = 4.27DD180 pKa = 5.16PGLEE184 pKa = 4.06NAAGGASSGGASSGGAAPSDD204 pKa = 3.52NSSADD209 pKa = 3.75DD210 pKa = 3.95EE211 pKa = 4.84ASSDD215 pKa = 3.64INNGANGGAAGGAEE229 pKa = 4.64DD230 pKa = 4.49NDD232 pKa = 3.94ASGGAIGNNSDD243 pKa = 3.58TGATGAGGDD252 pKa = 3.57FVLQNGQDD260 pKa = 3.49AQSQNSQFADD270 pKa = 3.27ITADD274 pKa = 3.66SPCTDD279 pKa = 3.82GEE281 pKa = 4.37NACVGSDD288 pKa = 3.52FAQCVGGKK296 pKa = 9.48FVTTSCGGNLICAALPLVNAPGTSVTCTTAADD328 pKa = 3.78RR329 pKa = 11.84DD330 pKa = 3.74ARR332 pKa = 11.84IAATGAA338 pKa = 3.25
Molecular weight: 33.5 kDa
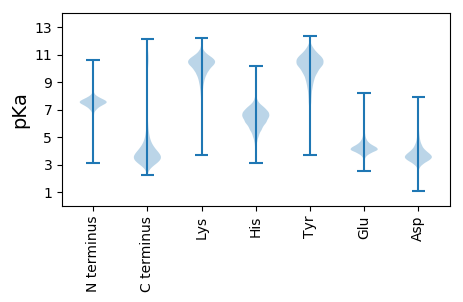
Isoelectric point according different methods:
Protein with the highest isoelectric point:
>tr|K5XHN1|K5XHN1_AGABU Uncharacterized protein (Fragment) OS=Agaricus bisporus var. burnettii (strain JB137-S8 / ATCC MYA-4627 / FGSC 10392) OX=597362 GN=AGABI1DRAFT_95986 PE=4 SV=1
MM1 pKa = 7.68ASQLRR6 pKa = 11.84THH8 pKa = 7.37APHH11 pKa = 6.99AWDD14 pKa = 3.65TTSTRR19 pKa = 11.84IGASPTCLRR28 pKa = 11.84ASTSTTTPSGSHH40 pKa = 5.69TPSPHH45 pKa = 5.78SLGPISGPKK54 pKa = 9.33DD55 pKa = 3.28ASIACSFCGRR65 pKa = 11.84VGHH68 pKa = 5.72MPRR71 pKa = 11.84RR72 pKa = 11.84CRR74 pKa = 11.84KK75 pKa = 8.74QKK77 pKa = 9.9HH78 pKa = 4.24ARR80 pKa = 11.84KK81 pKa = 9.1RR82 pKa = 11.84AQEE85 pKa = 3.88RR86 pKa = 11.84SRR88 pKa = 11.84LPGTSKK94 pKa = 11.35SNVTGPLGHH103 pKa = 7.35LSGIGAALPAVKK115 pKa = 9.42TPPTPPGDD123 pKa = 3.35VSTGSGSPGSDD134 pKa = 2.44IPLRR138 pKa = 11.84ASALGAYY145 pKa = 9.23SSPSSSPSSSSSPSSPLQLDD165 pKa = 3.98ADD167 pKa = 4.44FFWLADD173 pKa = 3.65TGATSHH179 pKa = 5.51MTPHH183 pKa = 6.4RR184 pKa = 11.84HH185 pKa = 4.39WFKK188 pKa = 10.55SYY190 pKa = 9.98SPHH193 pKa = 7.58RR194 pKa = 11.84IPIRR198 pKa = 11.84LADD201 pKa = 3.57NSTVYY206 pKa = 10.56SAGVGSS212 pKa = 3.81
MM1 pKa = 7.68ASQLRR6 pKa = 11.84THH8 pKa = 7.37APHH11 pKa = 6.99AWDD14 pKa = 3.65TTSTRR19 pKa = 11.84IGASPTCLRR28 pKa = 11.84ASTSTTTPSGSHH40 pKa = 5.69TPSPHH45 pKa = 5.78SLGPISGPKK54 pKa = 9.33DD55 pKa = 3.28ASIACSFCGRR65 pKa = 11.84VGHH68 pKa = 5.72MPRR71 pKa = 11.84RR72 pKa = 11.84CRR74 pKa = 11.84KK75 pKa = 8.74QKK77 pKa = 9.9HH78 pKa = 4.24ARR80 pKa = 11.84KK81 pKa = 9.1RR82 pKa = 11.84AQEE85 pKa = 3.88RR86 pKa = 11.84SRR88 pKa = 11.84LPGTSKK94 pKa = 11.35SNVTGPLGHH103 pKa = 7.35LSGIGAALPAVKK115 pKa = 9.42TPPTPPGDD123 pKa = 3.35VSTGSGSPGSDD134 pKa = 2.44IPLRR138 pKa = 11.84ASALGAYY145 pKa = 9.23SSPSSSPSSSSSPSSPLQLDD165 pKa = 3.98ADD167 pKa = 4.44FFWLADD173 pKa = 3.65TGATSHH179 pKa = 5.51MTPHH183 pKa = 6.4RR184 pKa = 11.84HH185 pKa = 4.39WFKK188 pKa = 10.55SYY190 pKa = 9.98SPHH193 pKa = 7.58RR194 pKa = 11.84IPIRR198 pKa = 11.84LADD201 pKa = 3.57NSTVYY206 pKa = 10.56SAGVGSS212 pKa = 3.81
Molecular weight: 22.01 kDa
Isoelectric point according different methods:
Peptides (in silico digests for buttom-up proteomics)
Below you can find in silico digests of the whole proteome with Trypsin, Chymotrypsin, Trypsin+LysC, LysN, ArgC proteases suitable for different mass spec machines.| Try ESI |
 |
|---|
| ChTry ESI |
 |
|---|
| ArgC ESI |
 |
|---|
| LysN ESI |
 |
|---|
| TryLysC ESI |
 |
|---|
| Try MALDI |
 |
|---|
| ChTry MALDI |
 |
|---|
| ArgC MALDI |
 |
|---|
| LysN MALDI |
 |
|---|
| TryLysC MALDI |
 |
|---|
| Try LTQ |
 |
|---|
| ChTry LTQ |
 |
|---|
| ArgC LTQ |
 |
|---|
| LysN LTQ |
 |
|---|
| TryLysC LTQ |
 |
|---|
| Try MSlow |
 |
|---|
| ChTry MSlow |
 |
|---|
| ArgC MSlow |
 |
|---|
| LysN MSlow |
 |
|---|
| TryLysC MSlow |
 |
|---|
| Try MShigh |
 |
|---|
| ChTry MShigh |
 |
|---|
| ArgC MShigh |
 |
|---|
| LysN MShigh |
 |
|---|
| TryLysC MShigh |
 |
|---|
General Statistics
Number of major isoforms |
Number of additional isoforms |
Number of all proteins |
Number of amino acids |
Min. Seq. Length |
Max. Seq. Length |
Avg. Seq. Length |
Avg. Mol. Weight |
|---|---|---|---|---|---|---|---|
4612704 |
43 |
4900 |
411.4 |
45.75 |
Amino acid frequency
Ala |
Cys |
Asp |
Glu |
Phe |
Gly |
His |
Ile |
Lys |
Leu |
|---|---|---|---|---|---|---|---|---|---|
7.698 ± 0.018 | 1.238 ± 0.009 |
5.606 ± 0.017 | 6.004 ± 0.023 |
3.911 ± 0.017 | 6.317 ± 0.022 |
2.594 ± 0.011 | 5.292 ± 0.015 |
4.938 ± 0.023 | 9.151 ± 0.026 |
Met |
Asn |
Gln |
Pro |
Arg |
Ser |
Thr |
Val |
Trp |
Tyr |
|---|---|---|---|---|---|---|---|---|---|
2.088 ± 0.008 | 3.845 ± 0.012 |
6.353 ± 0.027 | 3.79 ± 0.016 |
6.115 ± 0.018 | 8.73 ± 0.03 |
6.0 ± 0.014 | 6.171 ± 0.015 |
1.428 ± 0.01 | 2.733 ± 0.012 |
Most of the basic statistics you can see at this page can be downloaded from this CSV file
Proteome-pI is available under Creative Commons Attribution-NoDerivs license, for more details see here
| Reference: Kozlowski LP. Proteome-pI 2.0: Proteome Isoelectric Point Database Update. Nucleic Acids Res. 2021, doi: 10.1093/nar/gkab944 | Contact: Lukasz P. Kozlowski |
