Venturia nashicola
Taxonomy: cellular organisms; Eukaryota; Opisthokonta; Fungi; Dikarya; Ascomycota; saccharomyceta; Pezizomycotina; leotiomyceta; dothideomyceta; Dothideomycetes; Pleosporomycetidae; Venturiales; Venturiaceae; Venturia
Average proteome isoelectric point is 6.74
Get precalculated fractions of proteins
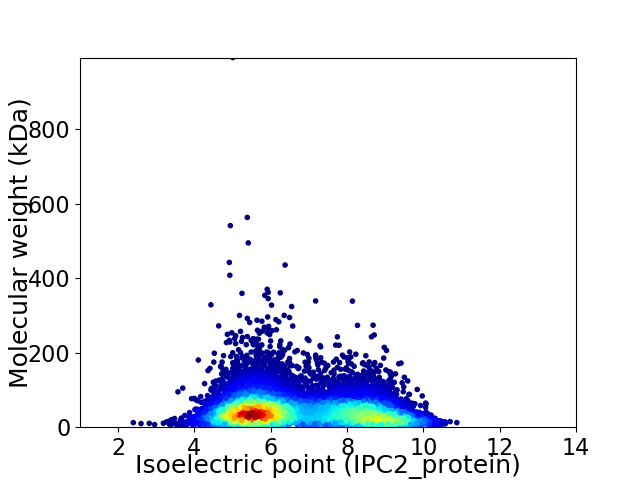
Virtual 2D-PAGE plot for 11754 proteins (isoelectric point calculated using IPC2_protein)
Get csv file with sequences according to given criteria:
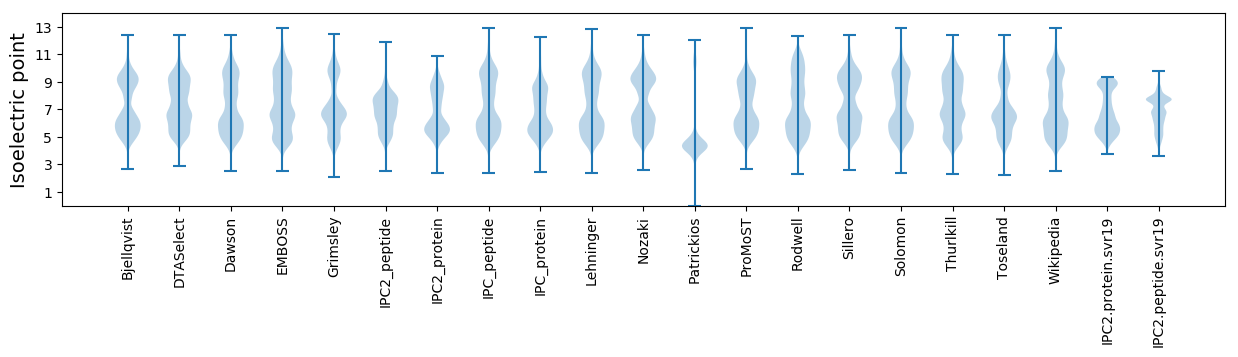
* You can choose from 21 different methods for calculating isoelectric point
Summary statistics related to proteome-wise predictions
Protein with the lowest isoelectric point:
>tr|A0A4Z1P151|A0A4Z1P151_9PEZI VHS subgroup OS=Venturia nashicola OX=86259 GN=E6O75_ATG10297 PE=4 SV=1
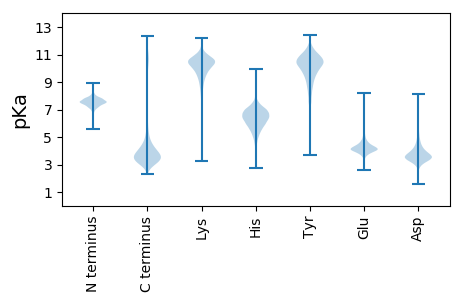
MM1 pKa = 7.84KK2 pKa = 9.83STTLFTAATALFASTIANPVNSGSKK27 pKa = 8.68STLSTADD34 pKa = 3.64LQSVDD39 pKa = 4.0TLLEE43 pKa = 4.25SNKK46 pKa = 9.9AFSDD50 pKa = 3.87EE51 pKa = 4.13AVVGHH56 pKa = 6.14VKK58 pKa = 10.74LPIDD62 pKa = 3.66NSEE65 pKa = 4.65TILSATPSAPLTGPTYY81 pKa = 11.04GNSSHH86 pKa = 6.87AGPRR90 pKa = 11.84IWAPVCSKK98 pKa = 10.83GCASTTTTTVIHH110 pKa = 6.38VSTSTAVVSTMTVTAGVSSSPASTLSDD137 pKa = 3.54YY138 pKa = 11.9SNAADD143 pKa = 4.51DD144 pKa = 4.58SSTSSSDD151 pKa = 2.99VDD153 pKa = 3.49VGYY156 pKa = 7.52MTSTQTLISTMTGANVTFSRR176 pKa = 11.84STVTLAMNTTSSYY189 pKa = 10.79TSLATVTIDD198 pKa = 3.23PTNSVTFTLTTEE210 pKa = 4.05TTMATTDD217 pKa = 3.18TAEE220 pKa = 4.16YY221 pKa = 10.74DD222 pKa = 3.54VTEE225 pKa = 4.27TMDD228 pKa = 3.41VASTISVDD236 pKa = 4.22SVIDD240 pKa = 3.91PDD242 pKa = 4.24TATACANAIVDD253 pKa = 3.71HH254 pKa = 6.35AVNLTVDD261 pKa = 4.04LTVDD265 pKa = 4.18LDD267 pKa = 3.69VCKK270 pKa = 10.58ALDD273 pKa = 3.88GVSIEE278 pKa = 4.14
MM1 pKa = 7.84KK2 pKa = 9.83STTLFTAATALFASTIANPVNSGSKK27 pKa = 8.68STLSTADD34 pKa = 3.64LQSVDD39 pKa = 4.0TLLEE43 pKa = 4.25SNKK46 pKa = 9.9AFSDD50 pKa = 3.87EE51 pKa = 4.13AVVGHH56 pKa = 6.14VKK58 pKa = 10.74LPIDD62 pKa = 3.66NSEE65 pKa = 4.65TILSATPSAPLTGPTYY81 pKa = 11.04GNSSHH86 pKa = 6.87AGPRR90 pKa = 11.84IWAPVCSKK98 pKa = 10.83GCASTTTTTVIHH110 pKa = 6.38VSTSTAVVSTMTVTAGVSSSPASTLSDD137 pKa = 3.54YY138 pKa = 11.9SNAADD143 pKa = 4.51DD144 pKa = 4.58SSTSSSDD151 pKa = 2.99VDD153 pKa = 3.49VGYY156 pKa = 7.52MTSTQTLISTMTGANVTFSRR176 pKa = 11.84STVTLAMNTTSSYY189 pKa = 10.79TSLATVTIDD198 pKa = 3.23PTNSVTFTLTTEE210 pKa = 4.05TTMATTDD217 pKa = 3.18TAEE220 pKa = 4.16YY221 pKa = 10.74DD222 pKa = 3.54VTEE225 pKa = 4.27TMDD228 pKa = 3.41VASTISVDD236 pKa = 4.22SVIDD240 pKa = 3.91PDD242 pKa = 4.24TATACANAIVDD253 pKa = 3.71HH254 pKa = 6.35AVNLTVDD261 pKa = 4.04LTVDD265 pKa = 4.18LDD267 pKa = 3.69VCKK270 pKa = 10.58ALDD273 pKa = 3.88GVSIEE278 pKa = 4.14
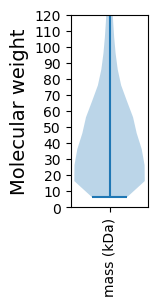
Molecular weight: 28.4 kDa
Isoelectric point according different methods:
Protein with the highest isoelectric point:
>tr|A0A4Z1NPF6|A0A4Z1NPF6_9PEZI Glycoside hydrolase family 1 protein OS=Venturia nashicola OX=86259 GN=E6O75_ATG10541 PE=3 SV=1
MM1 pKa = 7.76PKK3 pKa = 9.34VQTYY7 pKa = 7.42KK8 pKa = 10.69TYY10 pKa = 9.84IQPSIARR17 pKa = 11.84GRR19 pKa = 11.84SNSAAGRR26 pKa = 11.84GHH28 pKa = 6.76TSSTWRR34 pKa = 11.84RR35 pKa = 11.84FTRR38 pKa = 11.84WRR40 pKa = 11.84AVCAVNIGWKK50 pKa = 10.07DD51 pKa = 3.2RR52 pKa = 11.84SSRR55 pKa = 11.84EE56 pKa = 3.87NILKK60 pKa = 10.09LRR62 pKa = 11.84QLPPNEE68 pKa = 4.56TYY70 pKa = 10.85NSSFSQRR77 pKa = 11.84DD78 pKa = 3.68NVCHH82 pKa = 6.45EE83 pKa = 5.21EE84 pKa = 3.95IPVPDD89 pKa = 3.99KK90 pKa = 11.56SGDD93 pKa = 3.59GPLVGFSVQLGTSLQVNINCGIGTLLGSCSSTEE126 pKa = 3.83GHH128 pKa = 5.88VRR130 pKa = 11.84AGTQNQCMSQNTMPSLASKK149 pKa = 9.12VRR151 pKa = 11.84NWEE154 pKa = 3.75LHH156 pKa = 5.54LSSNSRR162 pKa = 11.84GGFAQAFRR170 pKa = 11.84FSRR173 pKa = 11.84VRR175 pKa = 11.84WLL177 pKa = 3.31
MM1 pKa = 7.76PKK3 pKa = 9.34VQTYY7 pKa = 7.42KK8 pKa = 10.69TYY10 pKa = 9.84IQPSIARR17 pKa = 11.84GRR19 pKa = 11.84SNSAAGRR26 pKa = 11.84GHH28 pKa = 6.76TSSTWRR34 pKa = 11.84RR35 pKa = 11.84FTRR38 pKa = 11.84WRR40 pKa = 11.84AVCAVNIGWKK50 pKa = 10.07DD51 pKa = 3.2RR52 pKa = 11.84SSRR55 pKa = 11.84EE56 pKa = 3.87NILKK60 pKa = 10.09LRR62 pKa = 11.84QLPPNEE68 pKa = 4.56TYY70 pKa = 10.85NSSFSQRR77 pKa = 11.84DD78 pKa = 3.68NVCHH82 pKa = 6.45EE83 pKa = 5.21EE84 pKa = 3.95IPVPDD89 pKa = 3.99KK90 pKa = 11.56SGDD93 pKa = 3.59GPLVGFSVQLGTSLQVNINCGIGTLLGSCSSTEE126 pKa = 3.83GHH128 pKa = 5.88VRR130 pKa = 11.84AGTQNQCMSQNTMPSLASKK149 pKa = 9.12VRR151 pKa = 11.84NWEE154 pKa = 3.75LHH156 pKa = 5.54LSSNSRR162 pKa = 11.84GGFAQAFRR170 pKa = 11.84FSRR173 pKa = 11.84VRR175 pKa = 11.84WLL177 pKa = 3.31
Molecular weight: 19.72 kDa
Isoelectric point according different methods:
Peptides (in silico digests for buttom-up proteomics)
Below you can find in silico digests of the whole proteome with Trypsin, Chymotrypsin, Trypsin+LysC, LysN, ArgC proteases suitable for different mass spec machines.| Try ESI |
 |
|---|
| ChTry ESI |
|
|---|
| ArgC ESI |
|
|---|
| LysN ESI |
|
|---|
| TryLysC ESI |
|
|---|
| Try MALDI |
|
|---|
| ChTry MALDI |
|
|---|
| ArgC MALDI |
|
|---|
| LysN MALDI |
|
|---|
| TryLysC MALDI |
|
|---|
| Try LTQ |
|
|---|
| ChTry LTQ |
|
|---|
| ArgC LTQ |
|
|---|
| LysN LTQ |
|
|---|
| TryLysC LTQ |
|
|---|
| Try MSlow |
|
|---|
| ChTry MSlow |
|
|---|
| ArgC MSlow |
|
|---|
| LysN MSlow |
|
|---|
| TryLysC MSlow |
|
|---|
| Try MShigh |
|
|---|
| ChTry MShigh |
|
|---|
| ArgC MShigh |
|
|---|
| LysN MShigh |
|
|---|
| TryLysC MShigh |
|
|---|
General Statistics
Number of major isoforms |
Number of additional isoforms |
Number of all proteins |
Number of amino acids |
Min. Seq. Length |
Max. Seq. Length |
Avg. Seq. Length |
Avg. Mol. Weight |
|---|---|---|---|---|---|---|---|
0 |
5212399 |
66 |
9086 |
443.5 |
49.07 |
Amino acid frequency
Ala |
Cys |
Asp |
Glu |
Phe |
Gly |
His |
Ile |
Lys |
Leu |
|---|---|---|---|---|---|---|---|---|---|
8.448 ± 0.021 | 1.194 ± 0.009 |
5.546 ± 0.015 | 6.257 ± 0.023 |
3.703 ± 0.016 | 6.894 ± 0.021 |
2.388 ± 0.01 | 4.995 ± 0.016 |
5.367 ± 0.022 | 8.607 ± 0.027 |
Met |
Asn |
Gln |
Pro |
Arg |
Ser |
Thr |
Val |
Trp |
Tyr |
|---|---|---|---|---|---|---|---|---|---|
2.271 ± 0.009 | 3.797 ± 0.013 |
6.145 ± 0.03 | 4.054 ± 0.019 |
5.913 ± 0.02 | 8.305 ± 0.026 |
6.113 ± 0.015 | 5.909 ± 0.016 |
1.426 ± 0.01 | 2.662 ± 0.011 |
Most of the basic statistics you can see at this page can be downloaded from this CSV file
See this proteome in:

Proteome-pI is available under Creative Commons Attribution-NoDerivs license, for more details see here
| Reference: Kozlowski LP. Proteome-pI 2.0: Proteome Isoelectric Point Database Update. Nucleic Acids Res. 2021, doi: 10.1093/nar/gkab944 | Contact: Lukasz P. Kozlowski |