Vibrio phage phi 2
Taxonomy: Viruses; Duplodnaviria; Heunggongvirae; Uroviricota; Caudoviricetes; Caudovirales; Myoviridae; unclassified Myoviridae
Average proteome isoelectric point is 6.44
Get precalculated fractions of proteins

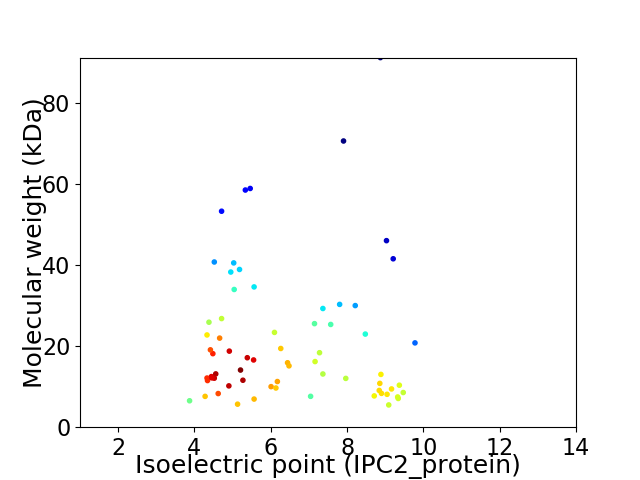
Virtual 2D-PAGE plot for 67 proteins (isoelectric point calculated using IPC2_protein)
Get csv file with sequences according to given criteria:
* You can choose from 21 different methods for calculating isoelectric point
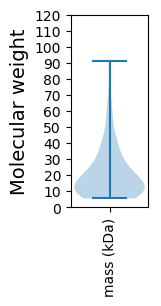
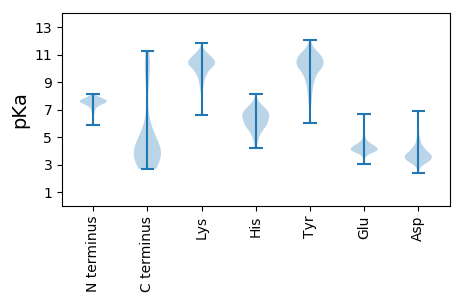
Summary statistics related to proteome-wise predictions


Protein with the lowest isoelectric point:
>tr|A0A067ZIB4|A0A067ZIB4_9CAUD Uncharacterized protein OS=Vibrio phage phi 2 OX=1476902 GN=Phi2_0067 PE=4 SV=1
MM1 pKa = 7.74SDD3 pKa = 2.95KK4 pKa = 11.08LKK6 pKa = 11.11NFVVNYY12 pKa = 7.65TLSNGVIGDD21 pKa = 3.86YY22 pKa = 10.69EE23 pKa = 4.3AVSPSSTLAALDD35 pKa = 4.03FCQFAYY41 pKa = 9.19EE42 pKa = 3.98NKK44 pKa = 9.02MAVSSISIDD53 pKa = 3.44EE54 pKa = 4.39AEE56 pKa = 4.54EE57 pKa = 4.33DD58 pKa = 4.22GEE60 pKa = 4.29
MM1 pKa = 7.74SDD3 pKa = 2.95KK4 pKa = 11.08LKK6 pKa = 11.11NFVVNYY12 pKa = 7.65TLSNGVIGDD21 pKa = 3.86YY22 pKa = 10.69EE23 pKa = 4.3AVSPSSTLAALDD35 pKa = 4.03FCQFAYY41 pKa = 9.19EE42 pKa = 3.98NKK44 pKa = 9.02MAVSSISIDD53 pKa = 3.44EE54 pKa = 4.39AEE56 pKa = 4.54EE57 pKa = 4.33DD58 pKa = 4.22GEE60 pKa = 4.29
Molecular weight: 6.52 kDa
Isoelectric point according different methods:
Protein with the highest isoelectric point:
>tr|A0A067ZG47|A0A067ZG47_9CAUD Late control D family protein OS=Vibrio phage phi 2 OX=1476902 GN=Phi2_0025 PE=4 SV=1
MM1 pKa = 6.8AAEE4 pKa = 5.42WITFDD9 pKa = 5.78DD10 pKa = 3.98SQKK13 pKa = 10.43QRR15 pKa = 11.84AEE17 pKa = 3.91LLLAGIRR24 pKa = 11.84DD25 pKa = 4.16GASKK29 pKa = 10.42AASRR33 pKa = 11.84AINRR37 pKa = 11.84AILTARR43 pKa = 11.84SEE45 pKa = 4.77SINKK49 pKa = 8.91ARR51 pKa = 11.84EE52 pKa = 3.91EE53 pKa = 4.31YY54 pKa = 9.27TVKK57 pKa = 10.9AKK59 pKa = 10.37DD60 pKa = 3.3VRR62 pKa = 11.84EE63 pKa = 3.87TLKK66 pKa = 10.51ISKK69 pKa = 7.87ATPRR73 pKa = 11.84RR74 pKa = 11.84PIAVISSLGAPLPLSSFQVSPKK96 pKa = 8.96TVNGKK101 pKa = 9.09RR102 pKa = 11.84RR103 pKa = 11.84SAIRR107 pKa = 11.84VSVKK111 pKa = 10.3KK112 pKa = 10.59GGRR115 pKa = 11.84QSFDD119 pKa = 2.77RR120 pKa = 11.84AFIARR125 pKa = 11.84PSGQIDD131 pKa = 3.73VYY133 pKa = 10.96EE134 pKa = 4.14RR135 pKa = 11.84AGKK138 pKa = 9.92KK139 pKa = 9.57RR140 pKa = 11.84LPIRR144 pKa = 11.84KK145 pKa = 8.63LFGPSVPQMVGNPKK159 pKa = 10.08VISHH163 pKa = 7.11IADD166 pKa = 3.68KK167 pKa = 10.81ARR169 pKa = 11.84EE170 pKa = 4.04MMDD173 pKa = 2.83KK174 pKa = 10.73RR175 pKa = 11.84LDD177 pKa = 3.66HH178 pKa = 6.9EE179 pKa = 4.47IGRR182 pKa = 11.84LLDD185 pKa = 3.6GARR188 pKa = 3.68
MM1 pKa = 6.8AAEE4 pKa = 5.42WITFDD9 pKa = 5.78DD10 pKa = 3.98SQKK13 pKa = 10.43QRR15 pKa = 11.84AEE17 pKa = 3.91LLLAGIRR24 pKa = 11.84DD25 pKa = 4.16GASKK29 pKa = 10.42AASRR33 pKa = 11.84AINRR37 pKa = 11.84AILTARR43 pKa = 11.84SEE45 pKa = 4.77SINKK49 pKa = 8.91ARR51 pKa = 11.84EE52 pKa = 3.91EE53 pKa = 4.31YY54 pKa = 9.27TVKK57 pKa = 10.9AKK59 pKa = 10.37DD60 pKa = 3.3VRR62 pKa = 11.84EE63 pKa = 3.87TLKK66 pKa = 10.51ISKK69 pKa = 7.87ATPRR73 pKa = 11.84RR74 pKa = 11.84PIAVISSLGAPLPLSSFQVSPKK96 pKa = 8.96TVNGKK101 pKa = 9.09RR102 pKa = 11.84RR103 pKa = 11.84SAIRR107 pKa = 11.84VSVKK111 pKa = 10.3KK112 pKa = 10.59GGRR115 pKa = 11.84QSFDD119 pKa = 2.77RR120 pKa = 11.84AFIARR125 pKa = 11.84PSGQIDD131 pKa = 3.73VYY133 pKa = 10.96EE134 pKa = 4.14RR135 pKa = 11.84AGKK138 pKa = 9.92KK139 pKa = 9.57RR140 pKa = 11.84LPIRR144 pKa = 11.84KK145 pKa = 8.63LFGPSVPQMVGNPKK159 pKa = 10.08VISHH163 pKa = 7.11IADD166 pKa = 3.68KK167 pKa = 10.81ARR169 pKa = 11.84EE170 pKa = 4.04MMDD173 pKa = 2.83KK174 pKa = 10.73RR175 pKa = 11.84LDD177 pKa = 3.66HH178 pKa = 6.9EE179 pKa = 4.47IGRR182 pKa = 11.84LLDD185 pKa = 3.6GARR188 pKa = 3.68
Molecular weight: 20.78 kDa
Isoelectric point according different methods:
Peptides (in silico digests for buttom-up proteomics)
Below you can find in silico digests of the whole proteome with Trypsin, Chymotrypsin, Trypsin+LysC, LysN, ArgC proteases suitable for different mass spec machines.| Try ESI |
 |
|---|
| ChTry ESI |
 |
|---|
| ArgC ESI |
 |
|---|
| LysN ESI |
 |
|---|
| TryLysC ESI |
 |
|---|
| Try MALDI |
 |
|---|
| ChTry MALDI |
 |
|---|
| ArgC MALDI |
 |
|---|
| LysN MALDI |
 |
|---|
| TryLysC MALDI |
 |
|---|
| Try LTQ |
 |
|---|
| ChTry LTQ |
 |
|---|
| ArgC LTQ |
 |
|---|
| LysN LTQ |
 |
|---|
| TryLysC LTQ |
 |
|---|
| Try MSlow |
 |
|---|
| ChTry MSlow |
 |
|---|
| ArgC MSlow |
 |
|---|
| LysN MSlow |
 |
|---|
| TryLysC MSlow |
 |
|---|
| Try MShigh |
 |
|---|
| ChTry MShigh |
 |
|---|
| ArgC MShigh |
 |
|---|
| LysN MShigh |
 |
|---|
| TryLysC MShigh |
 |
|---|
General Statistics
Number of major isoforms |
Number of additional isoforms |
Number of all proteins |
Number of amino acids |
Min. Seq. Length |
Max. Seq. Length |
Avg. Seq. Length |
Avg. Mol. Weight |
|---|---|---|---|---|---|---|---|
0 |
12878 |
48 |
878 |
192.2 |
21.49 |
Amino acid frequency
Ala |
Cys |
Asp |
Glu |
Phe |
Gly |
His |
Ile |
Lys |
Leu |
|---|---|---|---|---|---|---|---|---|---|
8.247 ± 0.685 | 1.095 ± 0.178 |
6.134 ± 0.329 | 6.958 ± 0.376 |
3.735 ± 0.17 | 6.748 ± 0.311 |
1.522 ± 0.171 | 6.375 ± 0.283 |
7.369 ± 0.418 | 8.239 ± 0.241 |
Met |
Asn |
Gln |
Pro |
Arg |
Ser |
Thr |
Val |
Trp |
Tyr |
|---|---|---|---|---|---|---|---|---|---|
2.563 ± 0.155 | 4.527 ± 0.241 |
4.1 ± 0.296 | 4.333 ± 0.284 |
4.946 ± 0.232 | 6.709 ± 0.412 |
5.342 ± 0.287 | 6.538 ± 0.347 |
1.522 ± 0.123 | 2.997 ± 0.197 |
Most of the basic statistics you can see at this page can be downloaded from this CSV file
Proteome-pI is available under Creative Commons Attribution-NoDerivs license, for more details see here
| Reference: Kozlowski LP. Proteome-pI 2.0: Proteome Isoelectric Point Database Update. Nucleic Acids Res. 2021, doi: 10.1093/nar/gkab944 | Contact: Lukasz P. Kozlowski |
