Vibrio phage phi-A318
Taxonomy: Viruses; Duplodnaviria; Heunggongvirae; Uroviricota; Caudoviricetes; Caudovirales; Autographiviridae; Colwellvirinae; Kaohsiungvirus; Vibrio virus A318
Average proteome isoelectric point is 6.06
Get precalculated fractions of proteins
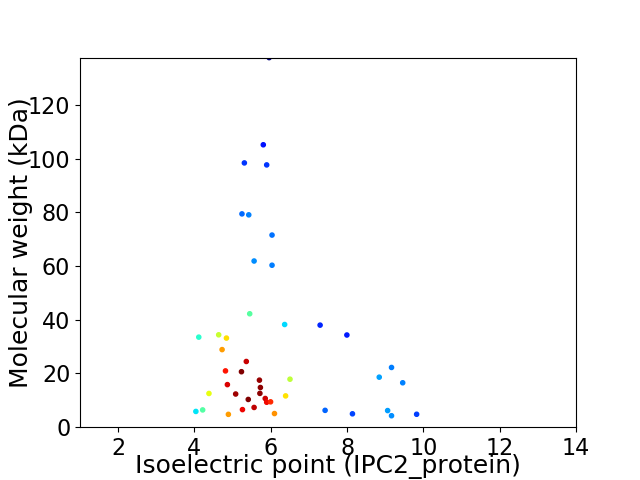
Virtual 2D-PAGE plot for 46 proteins (isoelectric point calculated using IPC2_protein)
Get csv file with sequences according to given criteria:
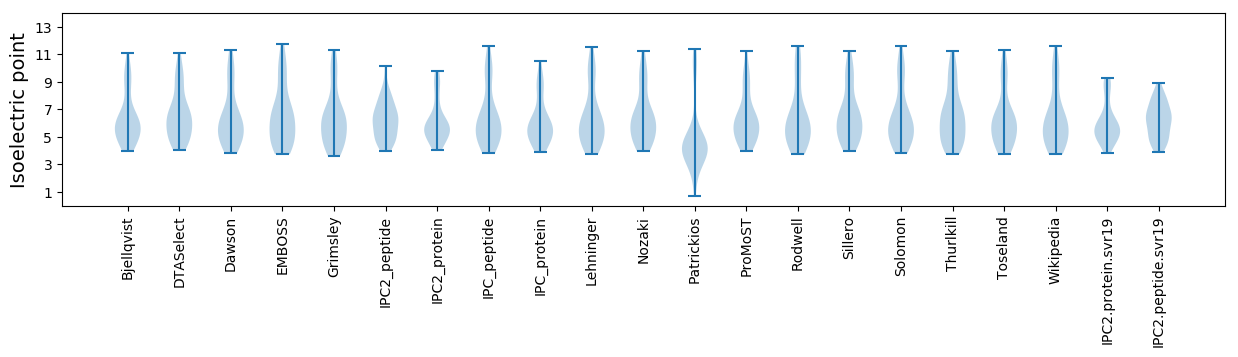
* You can choose from 21 different methods for calculating isoelectric point
Summary statistics related to proteome-wise predictions
Protein with the lowest isoelectric point:
>tr|A0A067YCN9|A0A067YCN9_9CAUD Uncharacterized protein OS=Vibrio phage phi-A318 OX=1151014 PE=4 SV=1
MM1 pKa = 7.14TKK3 pKa = 10.38KK4 pKa = 10.72LSFNDD9 pKa = 3.48WLEE12 pKa = 4.29LYY14 pKa = 10.2QDD16 pKa = 4.09EE17 pKa = 4.89LPEE20 pKa = 4.5EE21 pKa = 4.86GDD23 pKa = 3.77LYY25 pKa = 10.56PLYY28 pKa = 10.57EE29 pKa = 4.63EE30 pKa = 4.46YY31 pKa = 11.06LEE33 pKa = 4.35SVVDD37 pKa = 4.33AEE39 pKa = 5.62IEE41 pKa = 3.95TALINKK47 pKa = 7.18MHH49 pKa = 6.88
MM1 pKa = 7.14TKK3 pKa = 10.38KK4 pKa = 10.72LSFNDD9 pKa = 3.48WLEE12 pKa = 4.29LYY14 pKa = 10.2QDD16 pKa = 4.09EE17 pKa = 4.89LPEE20 pKa = 4.5EE21 pKa = 4.86GDD23 pKa = 3.77LYY25 pKa = 10.56PLYY28 pKa = 10.57EE29 pKa = 4.63EE30 pKa = 4.46YY31 pKa = 11.06LEE33 pKa = 4.35SVVDD37 pKa = 4.33AEE39 pKa = 5.62IEE41 pKa = 3.95TALINKK47 pKa = 7.18MHH49 pKa = 6.88
Molecular weight: 5.87 kDa
Isoelectric point according different methods:
Protein with the highest isoelectric point:
>tr|A0A067YAT9|A0A067YAT9_9CAUD Uncharacterized protein OS=Vibrio phage phi-A318 OX=1151014 PE=4 SV=1
MM1 pKa = 7.37SKK3 pKa = 10.3VDD5 pKa = 3.46EE6 pKa = 4.3KK7 pKa = 11.41LPRR10 pKa = 11.84KK11 pKa = 9.12KK12 pKa = 9.88HH13 pKa = 4.2NHH15 pKa = 5.41KK16 pKa = 10.01KK17 pKa = 9.58AHH19 pKa = 5.42EE20 pKa = 4.45TNSSRR25 pKa = 11.84NRR27 pKa = 11.84KK28 pKa = 9.56RR29 pKa = 11.84IRR31 pKa = 11.84EE32 pKa = 4.05MKK34 pKa = 10.46RR35 pKa = 11.84GWCNN39 pKa = 2.77
MM1 pKa = 7.37SKK3 pKa = 10.3VDD5 pKa = 3.46EE6 pKa = 4.3KK7 pKa = 11.41LPRR10 pKa = 11.84KK11 pKa = 9.12KK12 pKa = 9.88HH13 pKa = 4.2NHH15 pKa = 5.41KK16 pKa = 10.01KK17 pKa = 9.58AHH19 pKa = 5.42EE20 pKa = 4.45TNSSRR25 pKa = 11.84NRR27 pKa = 11.84KK28 pKa = 9.56RR29 pKa = 11.84IRR31 pKa = 11.84EE32 pKa = 4.05MKK34 pKa = 10.46RR35 pKa = 11.84GWCNN39 pKa = 2.77
Molecular weight: 4.82 kDa
Isoelectric point according different methods:
Peptides (in silico digests for buttom-up proteomics)
Below you can find in silico digests of the whole proteome with Trypsin, Chymotrypsin, Trypsin+LysC, LysN, ArgC proteases suitable for different mass spec machines.| Try ESI |
 |
|---|
| ChTry ESI |
|
|---|
| ArgC ESI |
|
|---|
| LysN ESI |
|
|---|
| TryLysC ESI |
|
|---|
| Try MALDI |
|
|---|
| ChTry MALDI |
|
|---|
| ArgC MALDI |
|
|---|
| LysN MALDI |
|
|---|
| TryLysC MALDI |
|
|---|
| Try LTQ |
|
|---|
| ChTry LTQ |
|
|---|
| ArgC LTQ |
|
|---|
| LysN LTQ |
|
|---|
| TryLysC LTQ |
|
|---|
| Try MSlow |
|
|---|
| ChTry MSlow |
|
|---|
| ArgC MSlow |
|
|---|
| LysN MSlow |
|
|---|
| TryLysC MSlow |
|
|---|
| Try MShigh |
|
|---|
| ChTry MShigh |
|
|---|
| ArgC MShigh |
|
|---|
| LysN MShigh |
|
|---|
| TryLysC MShigh |
|
|---|
General Statistics
Number of major isoforms |
Number of additional isoforms |
Number of all proteins |
Number of amino acids |
Min. Seq. Length |
Max. Seq. Length |
Avg. Seq. Length |
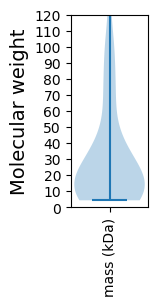
Avg. Mol. Weight |
|---|---|---|---|---|---|---|---|
0 |
12557 |
38 |
1229 |
273.0 |
30.75 |
Amino acid frequency
Ala |
Cys |
Asp |
Glu |
Phe |
Gly |
His |
Ile |
Lys |
Leu |
|---|---|---|---|---|---|---|---|---|---|
8.465 ± 0.556 | 1.011 ± 0.151 |
6.443 ± 0.198 | 7.685 ± 0.444 |
3.807 ± 0.201 | 6.873 ± 0.334 |
2.031 ± 0.21 | 5.439 ± 0.217 |
7.303 ± 0.283 | 8.067 ± 0.232 |
Met |
Asn |
Gln |
Pro |
Arg |
Ser |
Thr |
Val |
Trp |
Tyr |
|---|---|---|---|---|---|---|---|---|---|
3.074 ± 0.188 | 4.89 ± 0.177 |
3.544 ± 0.198 | 4.014 ± 0.256 |
5.16 ± 0.304 | 5.742 ± 0.345 |
5.248 ± 0.332 | 6.132 ± 0.308 |
1.354 ± 0.154 | 3.719 ± 0.185 |
Most of the basic statistics you can see at this page can be downloaded from this CSV file
See this proteome in:

Proteome-pI is available under Creative Commons Attribution-NoDerivs license, for more details see here
| Reference: Kozlowski LP. Proteome-pI 2.0: Proteome Isoelectric Point Database Update. Nucleic Acids Res. 2021, doi: 10.1093/nar/gkab944 | Contact: Lukasz P. Kozlowski |