Hubei diptera virus 14
Taxonomy: Viruses; Riboviria; unclassified Riboviria; unclassified RNA viruses ShiM-2016
Average proteome isoelectric point is 6.63
Get precalculated fractions of proteins

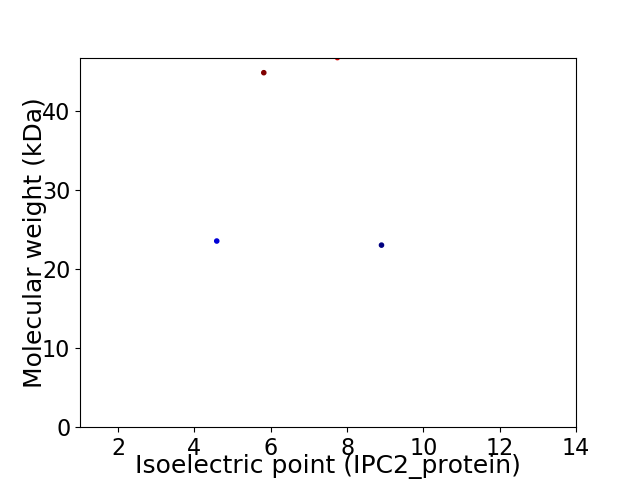
Virtual 2D-PAGE plot for 4 proteins (isoelectric point calculated using IPC2_protein)
Get csv file with sequences according to given criteria:
* You can choose from 21 different methods for calculating isoelectric point
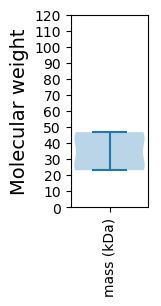
Summary statistics related to proteome-wise predictions


Protein with the lowest isoelectric point:
>tr|A0A1L3KEM7|A0A1L3KEM7_9VIRU Uncharacterized protein OS=Hubei diptera virus 14 OX=1922875 PE=4 SV=1
MM1 pKa = 7.33FNSFEE6 pKa = 4.26YY7 pKa = 8.77PTIVVNDD14 pKa = 3.85FNLLNGQFDD23 pKa = 4.58DD24 pKa = 4.89PPLGANMTYY33 pKa = 9.33QAPMAVASDD42 pKa = 3.48QSTIGGSRR50 pKa = 11.84IKK52 pKa = 10.7PEE54 pKa = 4.05VNFRR58 pKa = 11.84TPRR61 pKa = 11.84EE62 pKa = 3.42IWQGFEE68 pKa = 4.04RR69 pKa = 11.84NEE71 pKa = 3.91DD72 pKa = 3.53FYY74 pKa = 11.28EE75 pKa = 3.71IHH77 pKa = 6.4LQFGLFGPFSEE88 pKa = 5.16QQGADD93 pKa = 3.57PNIKK97 pKa = 10.08QGTLKK102 pKa = 10.07GTFEE106 pKa = 4.27VDD108 pKa = 2.92PKK110 pKa = 10.77EE111 pKa = 3.69FDD113 pKa = 3.48IIKK116 pKa = 10.15FMPGTFDD123 pKa = 3.6TFTTSNFGDD132 pKa = 3.61NAVATMMVLVRR143 pKa = 11.84KK144 pKa = 9.32LVIGIQFRR152 pKa = 11.84LPVFKK157 pKa = 9.93FTFEE161 pKa = 4.43LNRR164 pKa = 11.84DD165 pKa = 3.15IPINEE170 pKa = 4.57PYY172 pKa = 10.68NIILMGSWFLMRR184 pKa = 11.84HH185 pKa = 5.17GVRR188 pKa = 11.84SFRR191 pKa = 11.84SIEE194 pKa = 3.98DD195 pKa = 3.19QATVEE200 pKa = 4.17EE201 pKa = 4.82EE202 pKa = 3.85IEE204 pKa = 4.14EE205 pKa = 4.2
MM1 pKa = 7.33FNSFEE6 pKa = 4.26YY7 pKa = 8.77PTIVVNDD14 pKa = 3.85FNLLNGQFDD23 pKa = 4.58DD24 pKa = 4.89PPLGANMTYY33 pKa = 9.33QAPMAVASDD42 pKa = 3.48QSTIGGSRR50 pKa = 11.84IKK52 pKa = 10.7PEE54 pKa = 4.05VNFRR58 pKa = 11.84TPRR61 pKa = 11.84EE62 pKa = 3.42IWQGFEE68 pKa = 4.04RR69 pKa = 11.84NEE71 pKa = 3.91DD72 pKa = 3.53FYY74 pKa = 11.28EE75 pKa = 3.71IHH77 pKa = 6.4LQFGLFGPFSEE88 pKa = 5.16QQGADD93 pKa = 3.57PNIKK97 pKa = 10.08QGTLKK102 pKa = 10.07GTFEE106 pKa = 4.27VDD108 pKa = 2.92PKK110 pKa = 10.77EE111 pKa = 3.69FDD113 pKa = 3.48IIKK116 pKa = 10.15FMPGTFDD123 pKa = 3.6TFTTSNFGDD132 pKa = 3.61NAVATMMVLVRR143 pKa = 11.84KK144 pKa = 9.32LVIGIQFRR152 pKa = 11.84LPVFKK157 pKa = 9.93FTFEE161 pKa = 4.43LNRR164 pKa = 11.84DD165 pKa = 3.15IPINEE170 pKa = 4.57PYY172 pKa = 10.68NIILMGSWFLMRR184 pKa = 11.84HH185 pKa = 5.17GVRR188 pKa = 11.84SFRR191 pKa = 11.84SIEE194 pKa = 3.98DD195 pKa = 3.19QATVEE200 pKa = 4.17EE201 pKa = 4.82EE202 pKa = 3.85IEE204 pKa = 4.14EE205 pKa = 4.2
Molecular weight: 23.55 kDa
Isoelectric point according different methods:
Protein with the highest isoelectric point:
>tr|A0A1L3KEK4|A0A1L3KEK4_9VIRU Uncharacterized protein OS=Hubei diptera virus 14 OX=1922875 PE=4 SV=1
MM1 pKa = 6.86KK2 pKa = 9.29TCPVCQRR9 pKa = 11.84KK10 pKa = 7.94FVNKK14 pKa = 9.5QALKK18 pKa = 9.66QHH20 pKa = 6.46MDD22 pKa = 3.33SAHH25 pKa = 6.41GKK27 pKa = 7.06PAPVRR32 pKa = 11.84RR33 pKa = 11.84TKK35 pKa = 11.34NNINNMIVSRR45 pKa = 11.84GNDD48 pKa = 2.82NDD50 pKa = 3.06IPIRR54 pKa = 11.84IKK56 pKa = 10.5RR57 pKa = 11.84KK58 pKa = 9.35EE59 pKa = 4.08FIQAIDD65 pKa = 3.5KK66 pKa = 10.19TNLNGNLVFNPRR78 pKa = 11.84TAASSKK84 pKa = 10.19ILNKK88 pKa = 9.58FAKK91 pKa = 10.03IYY93 pKa = 10.63DD94 pKa = 3.6NYY96 pKa = 9.94IVHH99 pKa = 6.15SCSVQFVSGSRR110 pKa = 11.84STRR113 pKa = 11.84NGMVVVAVDD122 pKa = 3.79YY123 pKa = 10.78GSSSIVTNTKK133 pKa = 9.87EE134 pKa = 3.84NLYY137 pKa = 10.3ALPSVATQVHH147 pKa = 6.32SNSPVLKK154 pKa = 9.78ISVSNAVRR162 pKa = 11.84YY163 pKa = 10.49CNVTDD168 pKa = 4.2KK169 pKa = 11.39NRR171 pKa = 11.84DD172 pKa = 3.54NPFTIYY178 pKa = 9.76WYY180 pKa = 10.73CDD182 pKa = 3.07TTEE185 pKa = 4.01TDD187 pKa = 3.48GGVGDD192 pKa = 5.56LFLTYY197 pKa = 10.35DD198 pKa = 3.65IEE200 pKa = 4.98FKK202 pKa = 11.17GLTPP206 pKa = 4.75
MM1 pKa = 6.86KK2 pKa = 9.29TCPVCQRR9 pKa = 11.84KK10 pKa = 7.94FVNKK14 pKa = 9.5QALKK18 pKa = 9.66QHH20 pKa = 6.46MDD22 pKa = 3.33SAHH25 pKa = 6.41GKK27 pKa = 7.06PAPVRR32 pKa = 11.84RR33 pKa = 11.84TKK35 pKa = 11.34NNINNMIVSRR45 pKa = 11.84GNDD48 pKa = 2.82NDD50 pKa = 3.06IPIRR54 pKa = 11.84IKK56 pKa = 10.5RR57 pKa = 11.84KK58 pKa = 9.35EE59 pKa = 4.08FIQAIDD65 pKa = 3.5KK66 pKa = 10.19TNLNGNLVFNPRR78 pKa = 11.84TAASSKK84 pKa = 10.19ILNKK88 pKa = 9.58FAKK91 pKa = 10.03IYY93 pKa = 10.63DD94 pKa = 3.6NYY96 pKa = 9.94IVHH99 pKa = 6.15SCSVQFVSGSRR110 pKa = 11.84STRR113 pKa = 11.84NGMVVVAVDD122 pKa = 3.79YY123 pKa = 10.78GSSSIVTNTKK133 pKa = 9.87EE134 pKa = 3.84NLYY137 pKa = 10.3ALPSVATQVHH147 pKa = 6.32SNSPVLKK154 pKa = 9.78ISVSNAVRR162 pKa = 11.84YY163 pKa = 10.49CNVTDD168 pKa = 4.2KK169 pKa = 11.39NRR171 pKa = 11.84DD172 pKa = 3.54NPFTIYY178 pKa = 9.76WYY180 pKa = 10.73CDD182 pKa = 3.07TTEE185 pKa = 4.01TDD187 pKa = 3.48GGVGDD192 pKa = 5.56LFLTYY197 pKa = 10.35DD198 pKa = 3.65IEE200 pKa = 4.98FKK202 pKa = 11.17GLTPP206 pKa = 4.75
Molecular weight: 23.03 kDa
Isoelectric point according different methods:
Peptides (in silico digests for buttom-up proteomics)
Below you can find in silico digests of the whole proteome with Trypsin, Chymotrypsin, Trypsin+LysC, LysN, ArgC proteases suitable for different mass spec machines.| Try ESI |
 |
|---|
| ChTry ESI |
 |
|---|
| ArgC ESI |
 |
|---|
| LysN ESI |
 |
|---|
| TryLysC ESI |
 |
|---|
| Try MALDI |
 |
|---|
| ChTry MALDI |
 |
|---|
| ArgC MALDI |
 |
|---|
| LysN MALDI |
 |
|---|
| TryLysC MALDI |
 |
|---|
| Try LTQ |
 |
|---|
| ChTry LTQ |
 |
|---|
| ArgC LTQ |
 |
|---|
| LysN LTQ |
 |
|---|
| TryLysC LTQ |
 |
|---|
| Try MSlow |
 |
|---|
| ChTry MSlow |
 |
|---|
| ArgC MSlow |
 |
|---|
| LysN MSlow |
 |
|---|
| TryLysC MSlow |
 |
|---|
| Try MShigh |
 |
|---|
| ChTry MShigh |
 |
|---|
| ArgC MShigh |
 |
|---|
| LysN MShigh |
 |
|---|
| TryLysC MShigh |
 |
|---|
General Statistics
Number of major isoforms |
Number of additional isoforms |
Number of all proteins |
Number of amino acids |
Min. Seq. Length |
Max. Seq. Length |
Avg. Seq. Length |
Avg. Mol. Weight |
|---|---|---|---|---|---|---|---|
0 |
1226 |
205 |
434 |
306.5 |
34.54 |
Amino acid frequency
Ala |
Cys |
Asp |
Glu |
Phe |
Gly |
His |
Ile |
Lys |
Leu |
|---|---|---|---|---|---|---|---|---|---|
4.894 ± 0.615 | 1.958 ± 0.53 |
5.139 ± 0.422 | 5.791 ± 1.132 |
4.405 ± 1.595 | 7.586 ± 1.301 |
1.794 ± 0.182 | 6.281 ± 0.458 |
6.852 ± 0.799 | 7.586 ± 0.885 |
Met |
Asn |
Gln |
Pro |
Arg |
Ser |
Thr |
Val |
Trp |
Tyr |
|---|---|---|---|---|---|---|---|---|---|
2.855 ± 0.311 | 6.199 ± 1.056 |
4.241 ± 0.49 | 3.67 ± 0.29 |
4.078 ± 0.392 | 7.259 ± 0.805 |
5.628 ± 0.471 | 7.667 ± 0.945 |
1.713 ± 0.791 | 4.405 ± 0.803 |
Most of the basic statistics you can see at this page can be downloaded from this CSV file
Proteome-pI is available under Creative Commons Attribution-NoDerivs license, for more details see here
| Reference: Kozlowski LP. Proteome-pI 2.0: Proteome Isoelectric Point Database Update. Nucleic Acids Res. 2021, doi: 10.1093/nar/gkab944 | Contact: Lukasz P. Kozlowski |
