Ectothiorhodospira magna
Taxonomy: cellular organisms; Bacteria; Proteobacteria; Gammaproteobacteria; Chromatiales; Ectothiorhodospiraceae; Ectothiorhodospira
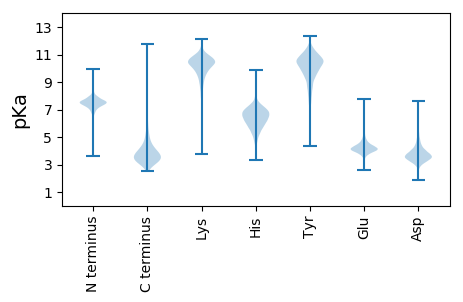
Average proteome isoelectric point is 6.44
Get precalculated fractions of proteins

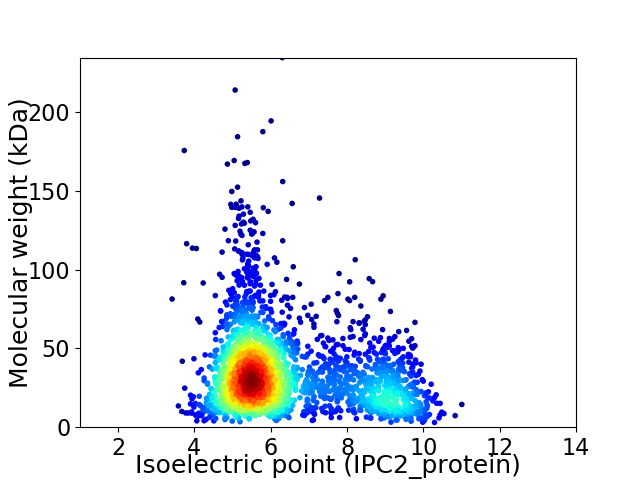
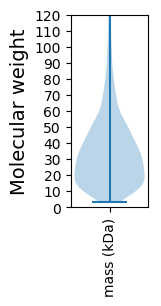
Virtual 2D-PAGE plot for 2463 proteins (isoelectric point calculated using IPC2_protein)
Get csv file with sequences according to given criteria:
* You can choose from 21 different methods for calculating isoelectric point
Summary statistics related to proteome-wise predictions


Protein with the lowest isoelectric point:
>tr|A0A1H9ANG4|A0A1H9ANG4_9GAMM DUF5610 domain-containing protein OS=Ectothiorhodospira magna OX=867345 GN=SAMN05421693_1062 PE=4 SV=1
MM1 pKa = 7.56HH2 pKa = 6.9STFKK6 pKa = 10.73KK7 pKa = 10.34AAITSAVTAALLAGGLVTSTASAEE31 pKa = 3.63ISANIGLTSNYY42 pKa = 9.49LFRR45 pKa = 11.84GVSEE49 pKa = 4.3SDD51 pKa = 3.12DD52 pKa = 3.35RR53 pKa = 11.84AAIQGGIDD61 pKa = 3.66FEE63 pKa = 4.98HH64 pKa = 7.01EE65 pKa = 3.89GGFYY69 pKa = 10.58LGTWTSSLDD78 pKa = 3.35GSADD82 pKa = 3.47RR83 pKa = 11.84GGYY86 pKa = 9.38EE87 pKa = 3.46VDD89 pKa = 4.26LYY91 pKa = 11.29FGVAGEE97 pKa = 4.31MGGSGVGFDD106 pKa = 3.57VGYY109 pKa = 10.27IYY111 pKa = 10.58YY112 pKa = 9.49AYY114 pKa = 9.5PGAEE118 pKa = 4.2SADD121 pKa = 3.33DD122 pKa = 4.01ANFGEE127 pKa = 5.38LYY129 pKa = 10.61GALDD133 pKa = 3.51FMGLYY138 pKa = 11.06GMINYY143 pKa = 6.98VTNADD148 pKa = 4.0DD149 pKa = 4.61SDD151 pKa = 4.71LEE153 pKa = 4.14SSLAYY158 pKa = 10.05EE159 pKa = 4.1IGYY162 pKa = 10.04SFGATPDD169 pKa = 3.2IALGATIGHH178 pKa = 5.95VNWDD182 pKa = 3.2HH183 pKa = 7.47RR184 pKa = 11.84DD185 pKa = 3.29WEE187 pKa = 4.79DD188 pKa = 3.52YY189 pKa = 9.56TWWSLYY195 pKa = 8.04LTKK198 pKa = 10.0ATAMGDD204 pKa = 3.22FTFAYY209 pKa = 7.04TQNDD213 pKa = 3.53TDD215 pKa = 4.15EE216 pKa = 6.5DD217 pKa = 4.4DD218 pKa = 4.62DD219 pKa = 4.15PRR221 pKa = 11.84FNVSFVMSFF230 pKa = 2.88
MM1 pKa = 7.56HH2 pKa = 6.9STFKK6 pKa = 10.73KK7 pKa = 10.34AAITSAVTAALLAGGLVTSTASAEE31 pKa = 3.63ISANIGLTSNYY42 pKa = 9.49LFRR45 pKa = 11.84GVSEE49 pKa = 4.3SDD51 pKa = 3.12DD52 pKa = 3.35RR53 pKa = 11.84AAIQGGIDD61 pKa = 3.66FEE63 pKa = 4.98HH64 pKa = 7.01EE65 pKa = 3.89GGFYY69 pKa = 10.58LGTWTSSLDD78 pKa = 3.35GSADD82 pKa = 3.47RR83 pKa = 11.84GGYY86 pKa = 9.38EE87 pKa = 3.46VDD89 pKa = 4.26LYY91 pKa = 11.29FGVAGEE97 pKa = 4.31MGGSGVGFDD106 pKa = 3.57VGYY109 pKa = 10.27IYY111 pKa = 10.58YY112 pKa = 9.49AYY114 pKa = 9.5PGAEE118 pKa = 4.2SADD121 pKa = 3.33DD122 pKa = 4.01ANFGEE127 pKa = 5.38LYY129 pKa = 10.61GALDD133 pKa = 3.51FMGLYY138 pKa = 11.06GMINYY143 pKa = 6.98VTNADD148 pKa = 4.0DD149 pKa = 4.61SDD151 pKa = 4.71LEE153 pKa = 4.14SSLAYY158 pKa = 10.05EE159 pKa = 4.1IGYY162 pKa = 10.04SFGATPDD169 pKa = 3.2IALGATIGHH178 pKa = 5.95VNWDD182 pKa = 3.2HH183 pKa = 7.47RR184 pKa = 11.84DD185 pKa = 3.29WEE187 pKa = 4.79DD188 pKa = 3.52YY189 pKa = 9.56TWWSLYY195 pKa = 8.04LTKK198 pKa = 10.0ATAMGDD204 pKa = 3.22FTFAYY209 pKa = 7.04TQNDD213 pKa = 3.53TDD215 pKa = 4.15EE216 pKa = 6.5DD217 pKa = 4.4DD218 pKa = 4.62DD219 pKa = 4.15PRR221 pKa = 11.84FNVSFVMSFF230 pKa = 2.88
Molecular weight: 24.77 kDa
Isoelectric point according different methods:
Protein with the highest isoelectric point:
>tr|A0A1H9BUR9|A0A1H9BUR9_9GAMM Putative transcriptional regulator OS=Ectothiorhodospira magna OX=867345 GN=SAMN05421693_1115 PE=4 SV=1
MM1 pKa = 7.1SRR3 pKa = 11.84SVRR6 pKa = 11.84IRR8 pKa = 11.84RR9 pKa = 11.84LSEE12 pKa = 3.55MMRR15 pKa = 11.84TRR17 pKa = 11.84LPIFSLRR24 pKa = 11.84IHH26 pKa = 6.41SKK28 pKa = 9.99ILSLSLSLSLSLSLSLSLSLSLSLSLSLSLSLSLSLSLSLSLNPSRR74 pKa = 11.84HH75 pKa = 4.86LHH77 pKa = 6.18LSHH80 pKa = 6.91LHH82 pKa = 6.26LSHH85 pKa = 6.91LHH87 pKa = 6.11LSHH90 pKa = 6.94LHH92 pKa = 5.98FSHH95 pKa = 7.75PLRR98 pKa = 11.84SRR100 pKa = 11.84LQMSSLIQQQVRR112 pKa = 11.84RR113 pKa = 11.84WLVGTRR119 pKa = 11.84RR120 pKa = 11.84PLPTTPLL127 pKa = 3.45
MM1 pKa = 7.1SRR3 pKa = 11.84SVRR6 pKa = 11.84IRR8 pKa = 11.84RR9 pKa = 11.84LSEE12 pKa = 3.55MMRR15 pKa = 11.84TRR17 pKa = 11.84LPIFSLRR24 pKa = 11.84IHH26 pKa = 6.41SKK28 pKa = 9.99ILSLSLSLSLSLSLSLSLSLSLSLSLSLSLSLSLSLSLSLSLNPSRR74 pKa = 11.84HH75 pKa = 4.86LHH77 pKa = 6.18LSHH80 pKa = 6.91LHH82 pKa = 6.26LSHH85 pKa = 6.91LHH87 pKa = 6.11LSHH90 pKa = 6.94LHH92 pKa = 5.98FSHH95 pKa = 7.75PLRR98 pKa = 11.84SRR100 pKa = 11.84LQMSSLIQQQVRR112 pKa = 11.84RR113 pKa = 11.84WLVGTRR119 pKa = 11.84RR120 pKa = 11.84PLPTTPLL127 pKa = 3.45
Molecular weight: 14.43 kDa
Isoelectric point according different methods:
Peptides (in silico digests for buttom-up proteomics)
Below you can find in silico digests of the whole proteome with Trypsin, Chymotrypsin, Trypsin+LysC, LysN, ArgC proteases suitable for different mass spec machines.| Try ESI |
 |
|---|
| ChTry ESI |
 |
|---|
| ArgC ESI |
 |
|---|
| LysN ESI |
 |
|---|
| TryLysC ESI |
 |
|---|
| Try MALDI |
 |
|---|
| ChTry MALDI |
 |
|---|
| ArgC MALDI |
 |
|---|
| LysN MALDI |
 |
|---|
| TryLysC MALDI |
 |
|---|
| Try LTQ |
 |
|---|
| ChTry LTQ |
 |
|---|
| ArgC LTQ |
 |
|---|
| LysN LTQ |
 |
|---|
| TryLysC LTQ |
 |
|---|
| Try MSlow |
 |
|---|
| ChTry MSlow |
 |
|---|
| ArgC MSlow |
 |
|---|
| LysN MSlow |
 |
|---|
| TryLysC MSlow |
 |
|---|
| Try MShigh |
 |
|---|
| ChTry MShigh |
 |
|---|
| ArgC MShigh |
 |
|---|
| LysN MShigh |
 |
|---|
| TryLysC MShigh |
 |
|---|
General Statistics
Number of major isoforms |
Number of additional isoforms |
Number of all proteins |
Number of amino acids |
Min. Seq. Length |
Max. Seq. Length |
Avg. Seq. Length |
Avg. Mol. Weight |
|---|---|---|---|---|---|---|---|
0 |
827883 |
25 |
2129 |
336.1 |
37.07 |
Amino acid frequency
Ala |
Cys |
Asp |
Glu |
Phe |
Gly |
His |
Ile |
Lys |
Leu |
|---|---|---|---|---|---|---|---|---|---|
10.459 ± 0.055 | 0.969 ± 0.016 |
5.865 ± 0.035 | 6.008 ± 0.046 |
3.385 ± 0.032 | 8.057 ± 0.042 |
2.703 ± 0.026 | 4.984 ± 0.036 |
2.705 ± 0.042 | 11.321 ± 0.066 |
Met |
Asn |
Gln |
Pro |
Arg |
Ser |
Thr |
Val |
Trp |
Tyr |
|---|---|---|---|---|---|---|---|---|---|
2.632 ± 0.022 | 2.598 ± 0.03 |
5.239 ± 0.035 | 4.333 ± 0.036 |
7.764 ± 0.052 | 4.861 ± 0.03 |
5.211 ± 0.033 | 7.316 ± 0.042 |
1.317 ± 0.021 | 2.274 ± 0.025 |
Most of the basic statistics you can see at this page can be downloaded from this CSV file
Proteome-pI is available under Creative Commons Attribution-NoDerivs license, for more details see here
| Reference: Kozlowski LP. Proteome-pI 2.0: Proteome Isoelectric Point Database Update. Nucleic Acids Res. 2021, doi: 10.1093/nar/gkab944 | Contact: Lukasz P. Kozlowski |
